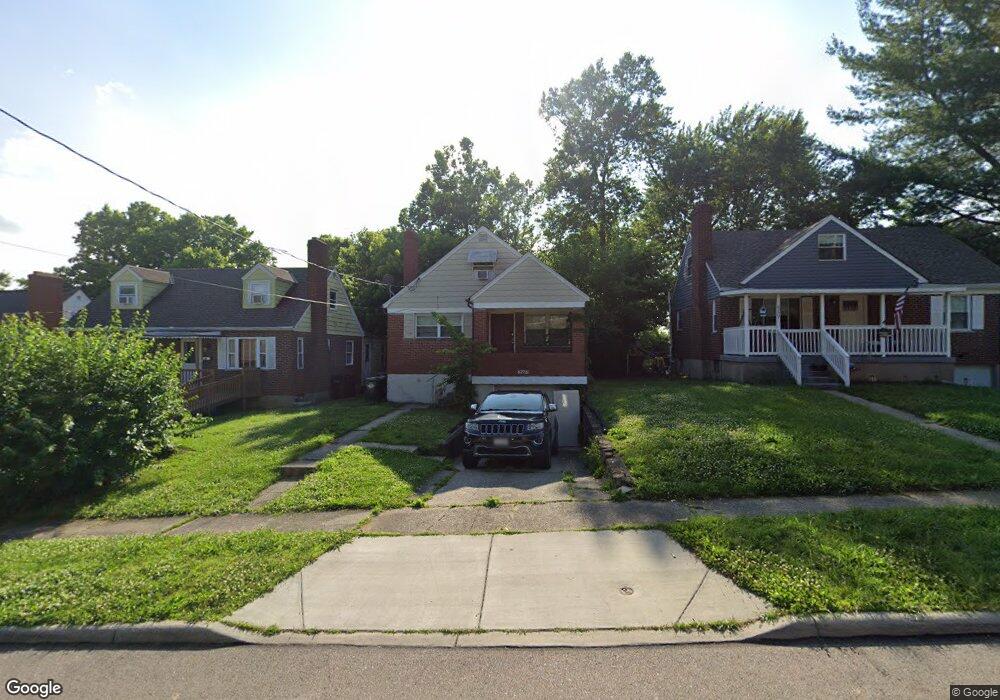
6273 Stover Ave Cincinnati, OH 45237
Estimated Value: $131,000 - $223,000
4
Beds
1
Bath
1,221
Sq Ft
$145/Sq Ft
Est. Value
About This Home
This home is located at 6273 Stover Ave, Cincinnati, OH 45237 and is currently estimated at $177,412, approximately $145 per square foot. 6273 Stover Ave is a home located in Hamilton County with nearby schools including Pleasant Ridge Montessori School, Shroder High School, and Clark Montessori High School.
Ownership History
Date
Name
Owned For
Owner Type
Purchase Details
Closed on
May 31, 2006
Sold by
Va
Bought by
Durham Edward E and Durham Heather F
Current Estimated Value
Home Financials for this Owner
Home Financials are based on the most recent Mortgage that was taken out on this home.
Original Mortgage
$63,900
Interest Rate
8.5%
Mortgage Type
Unknown
Purchase Details
Closed on
Oct 14, 2004
Sold by
Leisure Eric S and Leisure Angela D
Bought by
Va
Purchase Details
Closed on
Jun 27, 2000
Sold by
Wyche Vernon and Wyche Belinda L
Bought by
Leisure Eric S and Leisure Angela D
Home Financials for this Owner
Home Financials are based on the most recent Mortgage that was taken out on this home.
Original Mortgage
$91,650
Interest Rate
8.64%
Mortgage Type
VA
Purchase Details
Closed on
Jan 27, 2000
Sold by
Duncan Patricia
Bought by
Wyche Vernon and Wyche Belinda L
Home Financials for this Owner
Home Financials are based on the most recent Mortgage that was taken out on this home.
Original Mortgage
$50,400
Interest Rate
8.21%
Create a Home Valuation Report for This Property
The Home Valuation Report is an in-depth analysis detailing your home's value as well as a comparison with similar homes in the area
Home Values in the Area
Average Home Value in this Area
Purchase History
| Date | Buyer | Sale Price | Title Company |
|---|---|---|---|
| Durham Edward E | $71,000 | None Available | |
| Va | $64,000 | -- | |
| Leisure Eric S | $89,900 | -- | |
| Wyche Vernon | $63,000 | -- |
Source: Public Records
Mortgage History
| Date | Status | Borrower | Loan Amount |
|---|---|---|---|
| Previous Owner | Durham Edward E | $63,900 | |
| Previous Owner | Leisure Eric S | $91,650 | |
| Previous Owner | Wyche Vernon | $50,400 |
Source: Public Records
Tax History
| Year | Tax Paid | Tax Assessment Tax Assessment Total Assessment is a certain percentage of the fair market value that is determined by local assessors to be the total taxable value of land and additions on the property. | Land | Improvement |
|---|---|---|---|---|
| 2025 | $3,090 | $43,142 | $9,300 | $33,842 |
| 2023 | $3,065 | $43,142 | $9,300 | $33,842 |
| 2022 | $2,324 | $25,568 | $6,003 | $19,565 |
| 2021 | $2,251 | $25,568 | $6,003 | $19,565 |
| 2020 | $2,293 | $25,568 | $6,003 | $19,565 |
| 2019 | $2,296 | $22,628 | $5,313 | $17,315 |
| 2018 | $2,254 | $22,628 | $5,313 | $17,315 |
| 2017 | $2,190 | $22,628 | $5,313 | $17,315 |
| 2016 | $2,760 | $28,221 | $5,905 | $22,316 |
| 2015 | $2,569 | $28,221 | $5,905 | $22,316 |
| 2014 | $2,441 | $28,221 | $5,905 | $22,316 |
| 2013 | $2,466 | $28,221 | $5,905 | $22,316 |
Source: Public Records
Map
Nearby Homes
- 6211 Mayflower Ave
- 6110 Stover Ave
- 6402 Mayflower Ave
- 6202 Mayflower Ave
- 6424 Graceland Ave
- 6025 Mayflower Ave
- 2344 Losantiville Ave
- 2063 E Seymour Ave
- 7119 Eastlawn Dr
- 2436 Bremont Ave
- 2507 Kellerman Ave
- 2526 Bremont Ave
- 6750 Elbrook Ave
- 6771 Elbrook Ave
- 6770 Elbrook Ave
- 2537 Vera Ave
- 2539 Vera Ave
- 2541 Vera Ave
- 2543 Vera Ave
- 5447 Grafton Ave
- 6269 Stover Ave
- 6277 Stover Ave
- 6265 Stover Ave
- 6303 Stover Ave
- 6261 Stover Ave
- 6311 Stover Ave
- 6257 Stover Ave
- 6274 Stover Ave
- 6278 Stover Ave
- 6270 Stover Ave
- 6458 Wiehe Rd
- 6266 Stover Ave
- 6315 Stover Ave
- 6253 Stover Ave
- 6302 Stover Ave
- 6262 Stover Ave
- 6306 Stover Ave
- 6249 Stover Ave
- 6258 Stover Ave
- 6319 Stover Ave
Your Personal Tour Guide
Ask me questions while you tour the home.