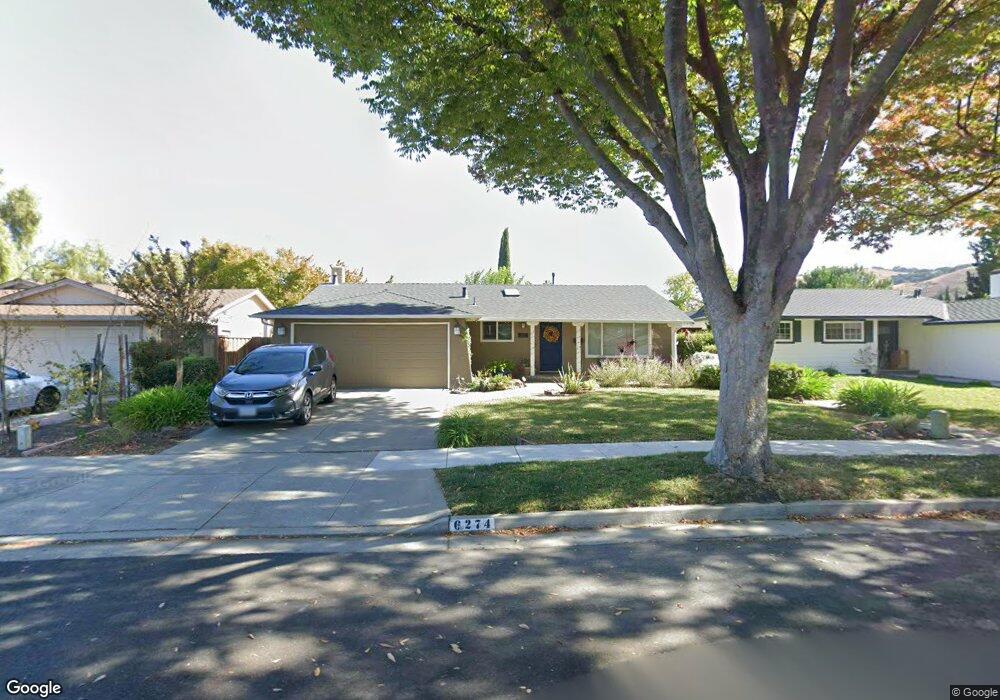
6274 Gunter Way San Jose, CA 95123
Santa Teresa Foothills NeighborhoodEstimated Value: $1,482,000 - $1,573,000
3
Beds
2
Baths
1,409
Sq Ft
$1,074/Sq Ft
Est. Value
About This Home
This home is located at 6274 Gunter Way, San Jose, CA 95123 and is currently estimated at $1,513,681, approximately $1,074 per square foot. 6274 Gunter Way is a home located in Santa Clara County with nearby schools including Sakamoto Elementary School, Herman (Leonard) Intermediate School, and Santa Teresa High School.
Ownership History
Date
Name
Owned For
Owner Type
Purchase Details
Closed on
Nov 29, 2004
Sold by
Duncan Matthew and Duncan Cynthia
Bought by
Duncan Matthew J and Duncan Cynthia W
Current Estimated Value
Purchase Details
Closed on
Sep 17, 1999
Sold by
Ryan Stephen M and Ryan Cathe R
Bought by
Duncan Matthew and Duncan Cynthia
Home Financials for this Owner
Home Financials are based on the most recent Mortgage that was taken out on this home.
Original Mortgage
$240,000
Outstanding Balance
$71,971
Interest Rate
7.97%
Estimated Equity
$1,441,710
Purchase Details
Closed on
Jul 12, 1994
Sold by
Satterwhite Robert P and Satterwhite Jeanne L
Bought by
Ryan Stephen M and Ryan Cathe R
Home Financials for this Owner
Home Financials are based on the most recent Mortgage that was taken out on this home.
Original Mortgage
$202,800
Interest Rate
8.38%
Create a Home Valuation Report for This Property
The Home Valuation Report is an in-depth analysis detailing your home's value as well as a comparison with similar homes in the area
Home Values in the Area
Average Home Value in this Area
Purchase History
| Date | Buyer | Sale Price | Title Company |
|---|---|---|---|
| Duncan Matthew J | -- | -- | |
| Duncan Matthew | $356,000 | Old Republic Title Company | |
| Ryan Stephen M | $213,500 | First American Title Guarant |
Source: Public Records
Mortgage History
| Date | Status | Borrower | Loan Amount |
|---|---|---|---|
| Open | Duncan Matthew | $240,000 | |
| Previous Owner | Ryan Stephen M | $202,800 | |
| Closed | Duncan Matthew | $80,000 |
Source: Public Records
Tax History Compared to Growth
Tax History
| Year | Tax Paid | Tax Assessment Tax Assessment Total Assessment is a certain percentage of the fair market value that is determined by local assessors to be the total taxable value of land and additions on the property. | Land | Improvement |
|---|---|---|---|---|
| 2025 | $8,222 | $547,141 | $246,212 | $300,929 |
| 2024 | $8,222 | $536,414 | $241,385 | $295,029 |
| 2023 | $8,074 | $525,897 | $236,652 | $289,245 |
| 2022 | $8,011 | $515,586 | $232,012 | $283,574 |
| 2021 | $7,864 | $505,477 | $227,463 | $278,014 |
| 2020 | $7,675 | $500,295 | $225,131 | $275,164 |
| 2019 | $7,485 | $490,486 | $220,717 | $269,769 |
| 2018 | $7,421 | $480,870 | $216,390 | $264,480 |
| 2017 | $7,318 | $471,443 | $212,148 | $259,295 |
| 2016 | $6,967 | $462,200 | $207,989 | $254,211 |
| 2015 | $6,809 | $455,258 | $204,865 | $250,393 |
| 2014 | $6,098 | $446,341 | $200,852 | $245,489 |
Source: Public Records
Map
Nearby Homes
- 6161 Iowa Dr
- 6298 Snell Ave
- 5834 Santa Teresa Blvd
- 625 Kiowa Cir
- 731 Los Huecos Dr
- 737 Los Huecos Dr
- 529 Galen Dr
- 5967 Shawcroft Dr
- 775 Sunset Glen Dr
- 783 Vereda Ct
- 729 Calero Ave
- 5857 Blossom Ave
- 482 Calero Ave
- 5991 Sorrel Ave
- 6239 Mahan Dr
- 5841 Blossom Ave
- 18950 Graystone Ln
- 415 Conestoga Way
- 6565 Stonehill Dr
- 5806 Blossom Ave
- 6270 Gunter Way
- 6278 Gunter Way
- 6247 Sager Way
- 6251 Sager Way
- 6266 Gunter Way
- 6282 Gunter Way
- 6243 Sager Way
- 6255 Sager Way
- 6273 Gunter Way
- 6239 Sager Way
- 6277 Gunter Way
- 6262 Gunter Way
- 6286 Gunter Way
- 6269 Gunter Way
- 6259 Sager Way
- 6281 Gunter Way
- 6235 Sager Way
- 6285 Gunter Way
- 6258 Gunter Way
- 6263 Sager Way