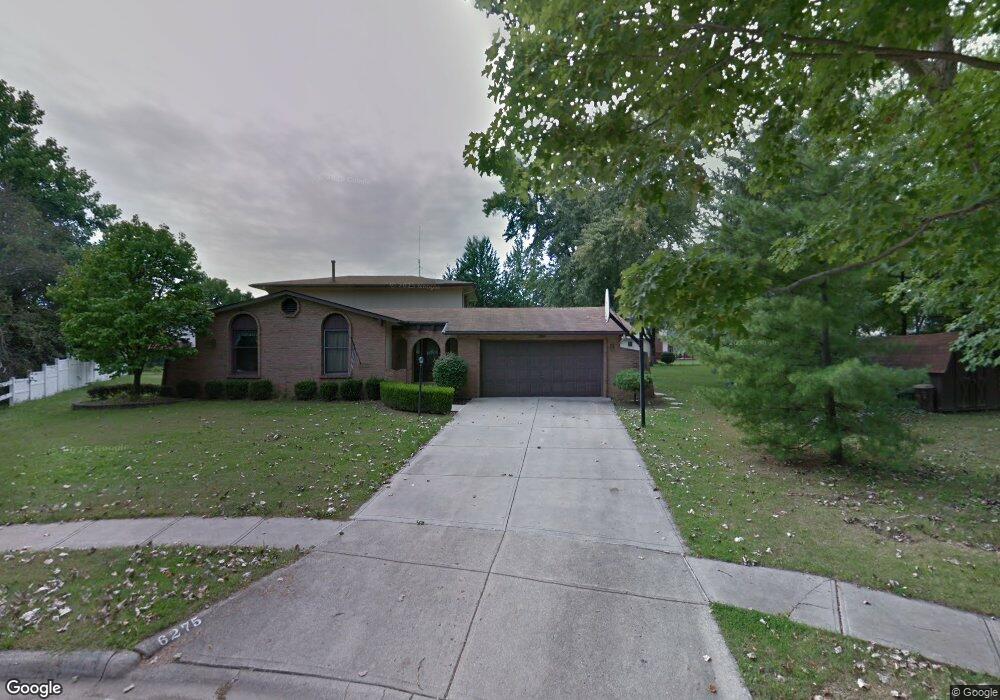
6275 Faymeadow Ln Columbus, OH 43229
Northgate NeighborhoodEstimated Value: $299,221 - $329,000
4
Beds
3
Baths
1,378
Sq Ft
$228/Sq Ft
Est. Value
About This Home
This home is located at 6275 Faymeadow Ln, Columbus, OH 43229 and is currently estimated at $313,555, approximately $227 per square foot. 6275 Faymeadow Ln is a home located in Franklin County with nearby schools including Northgate Intermediate, Alpine Elementary School, and Woodward Park Middle School.
Ownership History
Date
Name
Owned For
Owner Type
Purchase Details
Closed on
Aug 16, 2021
Sold by
Grant Roger D
Bought by
Grant Roger C
Current Estimated Value
Purchase Details
Closed on
Aug 8, 2019
Sold by
Roger D Grant Family Lp Ii
Bought by
Grant Roger D
Purchase Details
Closed on
May 23, 2013
Sold by
Grant Roger D
Bought by
Roger D Grant Family Limited Partnership
Purchase Details
Closed on
Jan 5, 1995
Sold by
Bowman Tony W
Bought by
Kitchen Bill L and Kitchen Carol A
Home Financials for this Owner
Home Financials are based on the most recent Mortgage that was taken out on this home.
Original Mortgage
$88,000
Interest Rate
9.27%
Mortgage Type
New Conventional
Create a Home Valuation Report for This Property
The Home Valuation Report is an in-depth analysis detailing your home's value as well as a comparison with similar homes in the area
Home Values in the Area
Average Home Value in this Area
Purchase History
| Date | Buyer | Sale Price | Title Company |
|---|---|---|---|
| Grant Roger C | -- | None Available | |
| Grant Roger D | -- | None Available | |
| Roger D Grant Family Limited Partnership | -- | None Available | |
| Kitchen Bill L | $98,000 | -- |
Source: Public Records
Mortgage History
| Date | Status | Borrower | Loan Amount |
|---|---|---|---|
| Previous Owner | Kitchen Bill L | $88,000 |
Source: Public Records
Tax History Compared to Growth
Tax History
| Year | Tax Paid | Tax Assessment Tax Assessment Total Assessment is a certain percentage of the fair market value that is determined by local assessors to be the total taxable value of land and additions on the property. | Land | Improvement |
|---|---|---|---|---|
| 2024 | $10,483 | $98,780 | $25,030 | $73,750 |
| 2023 | $4,377 | $98,770 | $25,025 | $73,745 |
| 2022 | $4,769 | $60,620 | $12,040 | $48,580 |
| 2021 | $3,227 | $60,620 | $12,040 | $48,580 |
| 2020 | $3,232 | $60,620 | $12,040 | $48,580 |
| 2019 | $2,997 | $48,200 | $9,630 | $38,570 |
| 2018 | $2,831 | $48,200 | $9,630 | $38,570 |
| 2017 | $2,997 | $48,200 | $9,630 | $38,570 |
| 2016 | $2,932 | $43,160 | $9,280 | $33,880 |
| 2015 | $2,670 | $43,160 | $9,280 | $33,880 |
| 2014 | $2,676 | $43,160 | $9,280 | $33,880 |
| 2013 | $1,426 | $47,950 | $10,290 | $37,660 |
Source: Public Records
Map
Nearby Homes
- 6245 Sharon Woods Blvd
- 6355 Johnanne St
- 6407 Skywae Dr
- 6496 Hearthstone Ave
- 6448 Sharon Woods Blvd Unit B
- 6342 Bellmeadow Dr
- 2197 Bayfield Dr
- 2120 Willowick Dr Unit B
- 1947 Rockdale Dr Unit 33
- 6458 Faircrest Rd
- 6407 Faircrest Rd
- 1635 Tendril Ct
- 1755 Hillandale Ave
- 2292 Laurelwood Dr Unit 2292L
- 1549 Alpine Dr
- 6048 Pinemoor St
- 2250 Webster Canyon Ct
- 6658 Walbridge St
- 6035 Karl Rd
- 1460 Burnley Square N
- 1915 Faymeadow Ave
- 6266 Faymeadow Ln
- 1905 Faymeadow Ave
- 6256 Skywae Dr
- 6262 Skywae Dr
- 6250 Skywae Dr
- 6272 Faymeadow Ln
- 1901 Faymeadow Ave
- 1935 Faymeadow Ave
- 6272 Skywae Dr
- 6242 Skywae Dr
- 6232 Skywae Dr
- 1945 Faymeadow Ave
- 6253 Sharon Woods Blvd
- 6249 Sharon Woods Blvd
- 6257 Sharon Woods Blvd
- 1871 Faymeadow Ave
- 1914 Faymeadow Ave
- 1906 Faymeadow Ave
- 6269 Sharon Woods Blvd