

6275 Short Rd Fairburn, GA 30213
Estimated payment $43,912/month
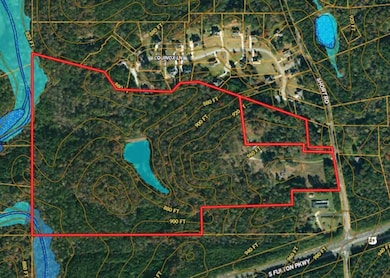
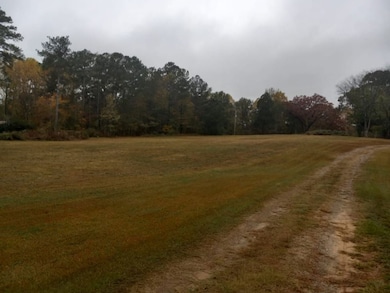
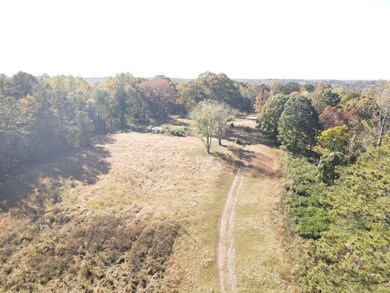
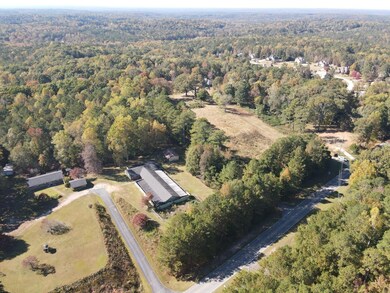
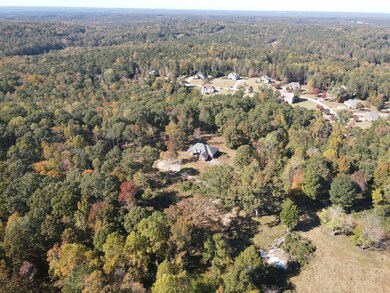
About This Lot
Short Road offers the following attributes:
Convenient access to surrounding amenities via Cascade Palmetto Hwy and South Fulton Parkway.
Less than 15 miles from Hartsfield-Jackson International Airport, the world’s busiest airport that employs more than 63,000 people.
Located in South Fulton, the 5th best-selling county in Metro Atlanta for new Single Family Detached (SFD) house sales.
There is currently a 37.8 months supply of vacant developed lots (VDLs) in all of Fulton County South of I-20.
Located in the Langston Hughes High School district which has an average detached new home sale price of $427,000 through 2Q23.
Sewer is located across Short Road and South Fulton Parkway. A lift station will need to be approved to access sewer.
With proximity to the Short Road and South Fulton Parkway intersection, there may be a potential to increase the density or a mixed-use project.

Property Details
Property Type
- Land
Est. Annual Taxes
- $34,865
Year Built
- 1963
Map
Home Values in the Area
Average Home Value in this Area
Tax History
| Year | Tax Paid | Tax Assessment Tax Assessment Total Assessment is a certain percentage of the fair market value that is determined by local assessors to be the total taxable value of land and additions on the property. | Land | Improvement |
|---|---|---|---|---|
| 2023 | $34,865 | $1,235,200 | $1,227,640 | $7,560 |
| 2022 | $7,952 | $202,800 | $200,000 | $2,800 |
| 2021 | $8,118 | $202,800 | $200,000 | $2,800 |
| 2020 | $20,220 | $496,920 | $491,480 | $5,440 |
| 2019 | $2,076 | $52,560 | $47,240 | $5,320 |
| 2018 | $1,756 | $44,120 | $39,120 | $5,000 |
| 2017 | $630 | $15,472 | $12,352 | $3,120 |
| 2016 | $631 | $15,470 | $12,350 | $3,120 |
| 2015 | $1,881 | $59,880 | $39,680 | $20,200 |
| 2014 | $1,520 | $54,200 | $35,920 | $18,280 |
Property History
| Date | Event | Price | Change | Sq Ft Price |
|---|---|---|---|---|
| 12/07/2023 12/07/23 | For Sale | $7,326,000 | -- | -- |
Purchase History
| Date | Type | Sale Price | Title Company |
|---|---|---|---|
| Deed | $150,000 | -- | |
| Quit Claim Deed | -- | -- |
Mortgage History
| Date | Status | Loan Amount | Loan Type |
|---|---|---|---|
| Open | $360,000 | New Conventional |
- 0 Short Rd Unit 7501417
- 7979 Larksview Dr
- 7994 Larksview Dr
- 7981 Gossamer Dr
- 8030 Snapwell Dr
- 6503 Foggy Oak Dr
- 7933 Heathmore Dr
- 5863 Landers Loop
- 6053 Park Close
- 6045 Park Close
- 6383 Edgewater Cove
- 470 Greyhawk Way Unit 1
- 539 Greyhawk Way
- 6329 Edgewater Cove
- 0 Cedar Grove Rd Unit 10449477
- 0 Cedar Grove Rd Unit 7516631
- 7705 Bellmist Dr Unit 3
- 7625 Cedar Grove Ct