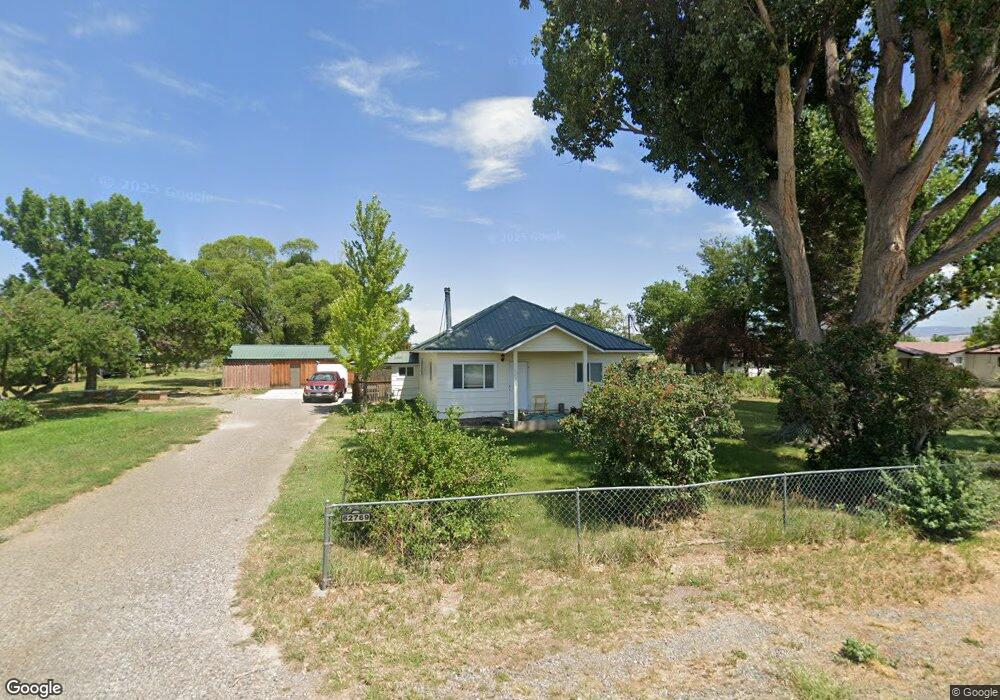
62769 Ohlm Rd Montrose, CO 81403
Estimated Value: $350,079 - $449,000
2
Beds
1
Bath
896
Sq Ft
$447/Sq Ft
Est. Value
About This Home
This home is located at 62769 Ohlm Rd, Montrose, CO 81403 and is currently estimated at $400,520, approximately $447 per square foot. 62769 Ohlm Rd is a home located in Montrose County with nearby schools including Oak Grove Elementary School, Columbine Middle School, and Montrose High School.
Ownership History
Date
Name
Owned For
Owner Type
Purchase Details
Closed on
Jan 10, 2018
Sold by
Jay Thomas
Bought by
Drexler Kateri
Current Estimated Value
Purchase Details
Closed on
Jul 30, 2014
Sold by
Jpmorgan Chase Bank Na
Bought by
Jay Thomas and Drexler Kateri
Purchase Details
Closed on
Dec 17, 2013
Sold by
Torres Albert O
Bought by
Jpmorgan Chase Bank Na
Purchase Details
Closed on
Jun 20, 2008
Sold by
Inman Ruby Hazel
Bought by
Torres Albert O
Home Financials for this Owner
Home Financials are based on the most recent Mortgage that was taken out on this home.
Original Mortgage
$165,500
Interest Rate
6.08%
Mortgage Type
New Conventional
Purchase Details
Closed on
Apr 11, 1994
Sold by
Inman Dan and Inman Ruby
Bought by
Inman Danny L and Inman Sandra M
Purchase Details
Closed on
Jul 9, 1953
Sold by
Nicks George B
Bought by
Inman Dan and Inman Ruby
Create a Home Valuation Report for This Property
The Home Valuation Report is an in-depth analysis detailing your home's value as well as a comparison with similar homes in the area
Home Values in the Area
Average Home Value in this Area
Purchase History
| Date | Buyer | Sale Price | Title Company |
|---|---|---|---|
| Drexler Kateri | -- | Land Title Guarantee Co | |
| Jay Thomas | $75,000 | Land Title Guarantee Company | |
| Jpmorgan Chase Bank Na | -- | None Available | |
| Torres Albert O | $160,000 | United Title Company | |
| Inman Danny L | -- | -- | |
| Inman Dan | -- | -- |
Source: Public Records
Mortgage History
| Date | Status | Borrower | Loan Amount |
|---|---|---|---|
| Previous Owner | Torres Albert O | $165,500 |
Source: Public Records
Tax History Compared to Growth
Tax History
| Year | Tax Paid | Tax Assessment Tax Assessment Total Assessment is a certain percentage of the fair market value that is determined by local assessors to be the total taxable value of land and additions on the property. | Land | Improvement |
|---|---|---|---|---|
| 2024 | $1,256 | $17,640 | $9,810 | $7,830 |
| 2023 | $1,256 | $22,120 | $12,300 | $9,820 |
| 2022 | $961 | $13,970 | $6,190 | $7,780 |
| 2021 | $964 | $14,370 | $6,360 | $8,010 |
| 2020 | $777 | $11,580 | $5,090 | $6,490 |
| 2019 | $782 | $11,580 | $5,090 | $6,490 |
| 2018 | $671 | $9,690 | $4,100 | $5,590 |
| 2017 | $665 | $9,690 | $4,100 | $5,590 |
| 2016 | $648 | $9,600 | $3,780 | $5,820 |
| 2015 | $638 | $9,600 | $3,780 | $5,820 |
| 2014 | $580 | $9,350 | $4,200 | $5,150 |
Source: Public Records
Map
Nearby Homes
- 16574 6275 Rd
- 16188 6280 Rd
- TBD Orange Rd
- 61976 Highway 90
- 15567 6282 Rd
- 62859 Niagara Rd
- 62592 N Star Dr
- 62781 Highway 90
- 63762 Nancy Way
- TBD 6270 Rd
- 901 Howard Fork Ave
- 607 Vermillion Ave
- 16346 Olive Ct
- 16303 6420 Rd
- Lot 2 6260 Rd
- 612 Carbonero Ave
- 604 Carbonero Ave
- 1511 River Rock Dr
- 15183 6260 Rd
- Lot 7 6260 Rd