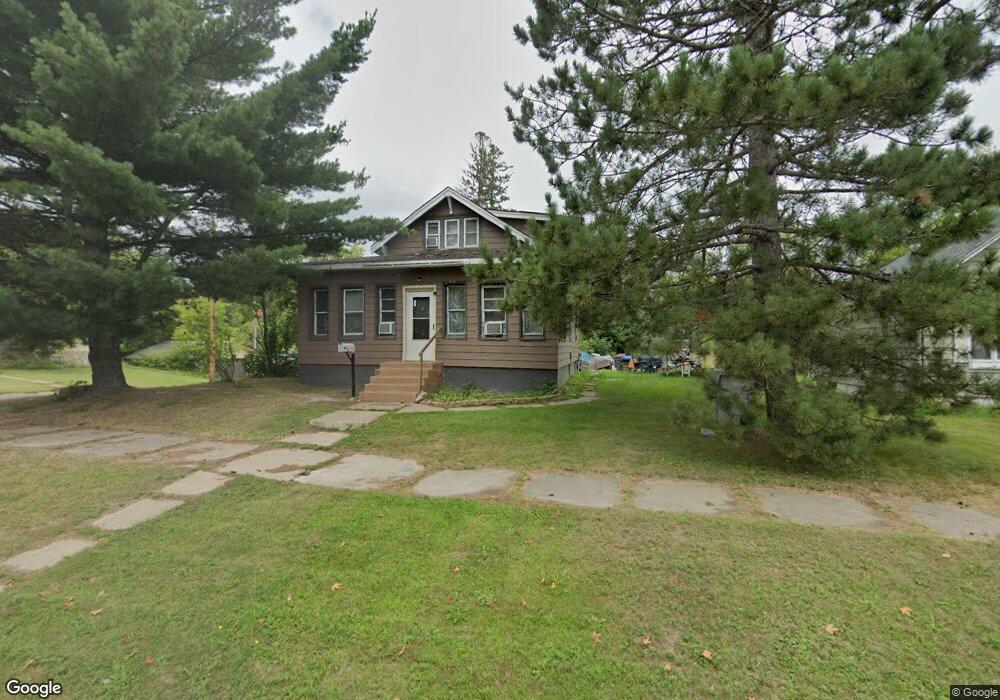
628 3rd St NW Chisholm, MN 55719
Estimated Value: $122,679 - $159,000
3
Beds
2
Baths
1,421
Sq Ft
$99/Sq Ft
Est. Value
About This Home
This home is located at 628 3rd St NW, Chisholm, MN 55719 and is currently estimated at $140,170, approximately $98 per square foot. 628 3rd St NW is a home located in St. Louis County with nearby schools including Vaughan Elementary School, Chisholm Elementary School, and Chisholm Secondary School.
Ownership History
Date
Name
Owned For
Owner Type
Purchase Details
Closed on
Feb 15, 2008
Sold by
Bayliss Michael and Bayliss Susan J
Bought by
Rossell Duane R and Rossell Christa M
Current Estimated Value
Home Financials for this Owner
Home Financials are based on the most recent Mortgage that was taken out on this home.
Original Mortgage
$68,996
Outstanding Balance
$42,589
Interest Rate
5.74%
Mortgage Type
FHA
Estimated Equity
$97,581
Purchase Details
Closed on
Aug 1, 2007
Sold by
Hud
Bought by
Bayliss Michael
Purchase Details
Closed on
Dec 14, 2006
Sold by
Mid First Bank
Bought by
Hud
Purchase Details
Closed on
Jun 13, 2006
Sold by
Pessenda Edward and Passenda Janmarie
Bought by
Midfirst Bank
Create a Home Valuation Report for This Property
The Home Valuation Report is an in-depth analysis detailing your home's value as well as a comparison with similar homes in the area
Home Values in the Area
Average Home Value in this Area
Purchase History
| Date | Buyer | Sale Price | Title Company |
|---|---|---|---|
| Rossell Duane R | $70,078 | None Available | |
| Bayliss Michael | -- | Consolidated | |
| Hud | -- | Arrowhead | |
| Midfirst Bank | $51,792 | None Available |
Source: Public Records
Mortgage History
| Date | Status | Borrower | Loan Amount |
|---|---|---|---|
| Open | Rossell Duane R | $68,996 |
Source: Public Records
Tax History Compared to Growth
Tax History
| Year | Tax Paid | Tax Assessment Tax Assessment Total Assessment is a certain percentage of the fair market value that is determined by local assessors to be the total taxable value of land and additions on the property. | Land | Improvement |
|---|---|---|---|---|
| 2024 | $528 | $86,500 | $8,400 | $78,100 |
| 2023 | $528 | $82,100 | $8,400 | $73,700 |
| 2022 | $450 | $63,600 | $6,500 | $57,100 |
| 2021 | $512 | $69,300 | $3,900 | $65,400 |
| 2020 | $466 | $69,300 | $3,900 | $65,400 |
| 2019 | $432 | $69,300 | $3,900 | $65,400 |
| 2018 | $388 | $64,900 | $3,900 | $61,000 |
| 2017 | $336 | $64,900 | $3,900 | $61,000 |
| 2016 | $332 | $60,400 | $6,300 | $54,100 |
| 2015 | $427 | $34,600 | $3,800 | $30,800 |
| 2014 | $427 | $35,200 | $3,800 | $31,400 |
Source: Public Records
Map
Nearby Homes