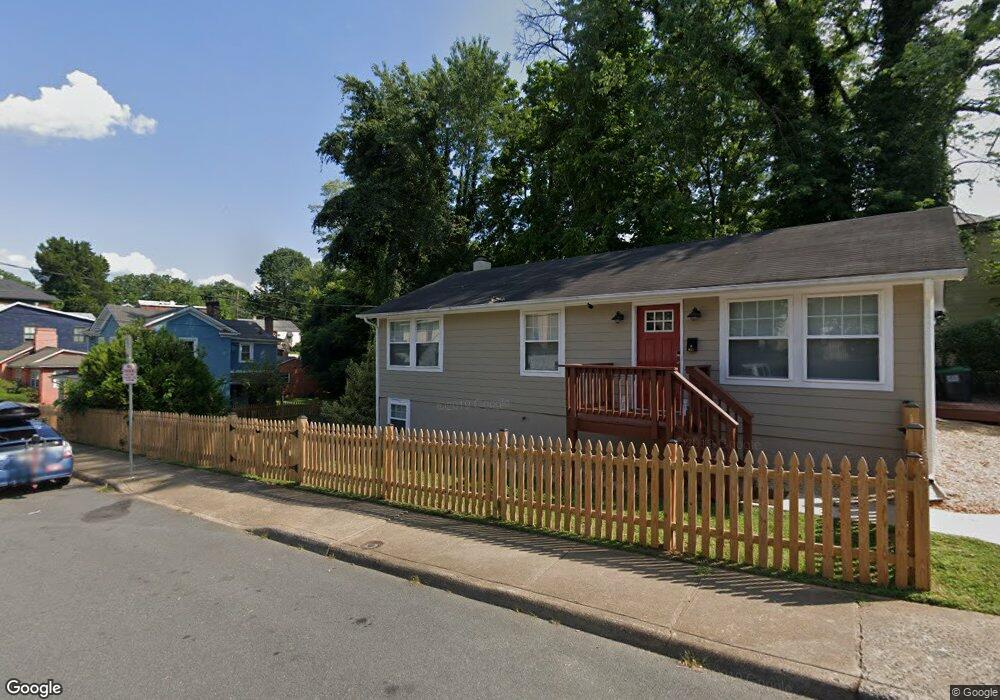
628 Dice St Charlottesville, VA 22903
Fifeville NeighborhoodEstimated Value: $512,000 - $625,000
3
Beds
3
Baths
1,896
Sq Ft
$289/Sq Ft
Est. Value
About This Home
This home is located at 628 Dice St, Charlottesville, VA 22903 and is currently estimated at $547,125, approximately $288 per square foot. 628 Dice St is a home located in Charlottesville City with nearby schools including Johnson Elementary School, Buford Middle School, and Charlottesville High School.
Ownership History
Date
Name
Owned For
Owner Type
Purchase Details
Closed on
Nov 2, 2017
Sold by
Argent Dev Llc
Bought by
Berg Sean D and Berg Kelly M W
Current Estimated Value
Home Financials for this Owner
Home Financials are based on the most recent Mortgage that was taken out on this home.
Original Mortgage
$200,000
Outstanding Balance
$109,830
Interest Rate
3.83%
Mortgage Type
New Conventional
Estimated Equity
$437,295
Purchase Details
Closed on
Mar 27, 1992
Bought by
Jones Brenda J
Purchase Details
Closed on
Dec 21, 1981
Bought by
Jones Brenda J
Create a Home Valuation Report for This Property
The Home Valuation Report is an in-depth analysis detailing your home's value as well as a comparison with similar homes in the area
Home Values in the Area
Average Home Value in this Area
Purchase History
| Date | Buyer | Sale Price | Title Company |
|---|---|---|---|
| Berg Sean D | $300,000 | Chicago Title Ins Co | |
| Jones Brenda J | -- | -- | |
| Jones Brenda J | $4,100 | -- |
Source: Public Records
Mortgage History
| Date | Status | Borrower | Loan Amount |
|---|---|---|---|
| Open | Berg Sean D | $200,000 |
Source: Public Records
Tax History Compared to Growth
Tax History
| Year | Tax Paid | Tax Assessment Tax Assessment Total Assessment is a certain percentage of the fair market value that is determined by local assessors to be the total taxable value of land and additions on the property. | Land | Improvement |
|---|---|---|---|---|
| 2025 | $4,904 | $493,100 | $130,000 | $363,100 |
| 2024 | $4,904 | $457,900 | $125,000 | $332,900 |
| 2023 | $4,242 | $434,400 | $115,000 | $319,400 |
| 2022 | $3,561 | $363,400 | $95,000 | $268,400 |
| 2021 | $3,310 | $340,800 | $79,300 | $261,500 |
| 2020 | $3,270 | $336,600 | $77,700 | $258,900 |
| 2019 | $3,207 | $330,000 | $76,200 | $253,800 |
| 2018 | $1,053 | $214,100 | $69,300 | $144,800 |
| 2017 | $2,106 | $214,061 | $69,300 | $144,761 |
| 2016 | $1,946 | $197,300 | $56,800 | $140,500 |
| 2015 | $1,989 | $197,300 | $56,800 | $140,500 |
| 2014 | $1,989 | $205,600 | $59,200 | $146,400 |
Source: Public Records
Map
Nearby Homes