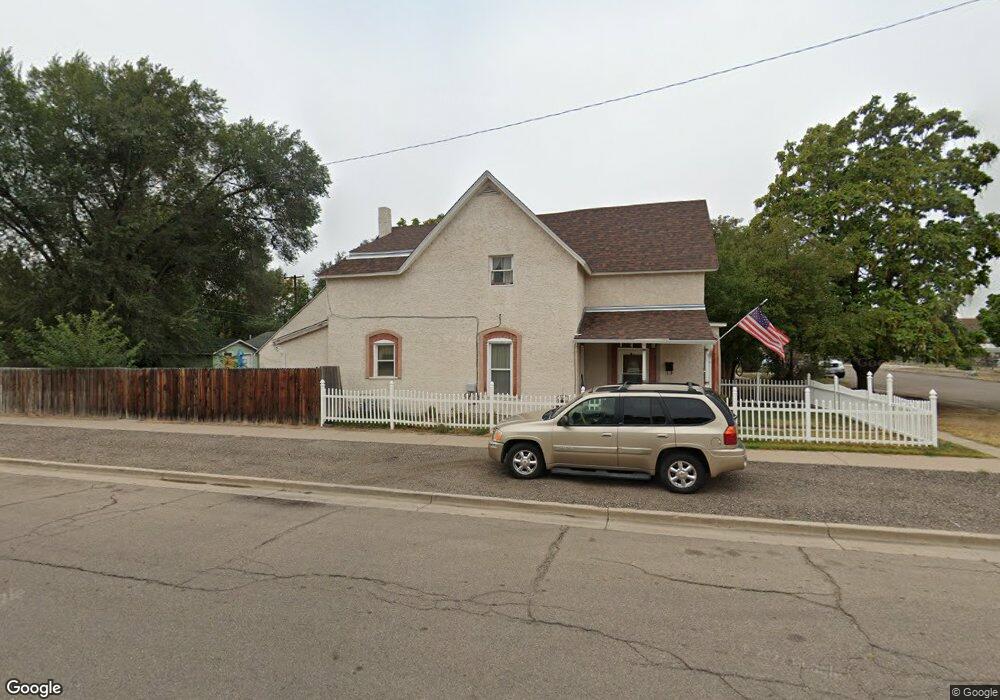
628 E 3rd St Pueblo, CO 81001
Lower East Side NeighborhoodEstimated Value: $163,343 - $217,000
4
Beds
2
Baths
1,790
Sq Ft
$107/Sq Ft
Est. Value
About This Home
This home is located at 628 E 3rd St, Pueblo, CO 81001 and is currently estimated at $191,781, approximately $107 per square foot. 628 E 3rd St is a home located in Pueblo County with nearby schools including Bradford Elementary School, Risley International Academy of Innovation, and Centennial High School.
Ownership History
Date
Name
Owned For
Owner Type
Purchase Details
Closed on
Jun 30, 2000
Sold by
Vega Joseph D
Bought by
Guyette Loney + Mary
Current Estimated Value
Purchase Details
Closed on
Nov 10, 1992
Sold by
Nt
Bought by
Vega Joseph D
Purchase Details
Closed on
Sep 30, 1976
Sold by
Moorhead Ralph Stevens
Bought by
Nt
Purchase Details
Closed on
Feb 27, 1975
Sold by
Paglione Richard
Bought by
Moorhead Ralph Stevens
Create a Home Valuation Report for This Property
The Home Valuation Report is an in-depth analysis detailing your home's value as well as a comparison with similar homes in the area
Home Values in the Area
Average Home Value in this Area
Purchase History
| Date | Buyer | Sale Price | Title Company |
|---|---|---|---|
| Guyette Loney + Mary | $69,300 | -- | |
| Vega Joseph D | -- | -- | |
| Nt | -- | -- | |
| Moorhead Ralph Stevens | -- | -- |
Source: Public Records
Tax History
| Year | Tax Paid | Tax Assessment Tax Assessment Total Assessment is a certain percentage of the fair market value that is determined by local assessors to be the total taxable value of land and additions on the property. | Land | Improvement |
|---|---|---|---|---|
| 2024 | $722 | $7,320 | -- | -- |
| 2023 | $730 | $11,010 | $1,010 | $10,000 |
| 2022 | $788 | $7,930 | $230 | $7,700 |
| 2021 | $830 | $8,340 | $240 | $8,100 |
| 2020 | $534 | $5,290 | $100 | $5,190 |
| 2019 | $534 | $5,289 | $99 | $5,190 |
| 2018 | $365 | $4,033 | $99 | $3,934 |
| 2017 | $369 | $4,033 | $99 | $3,934 |
| 2016 | $341 | $3,758 | $110 | $3,648 |
| 2015 | $170 | $3,758 | $110 | $3,648 |
| 2014 | $383 | $4,226 | $110 | $4,116 |
Source: Public Records
Map
Nearby Homes
Your Personal Tour Guide
Ask me questions while you tour the home.