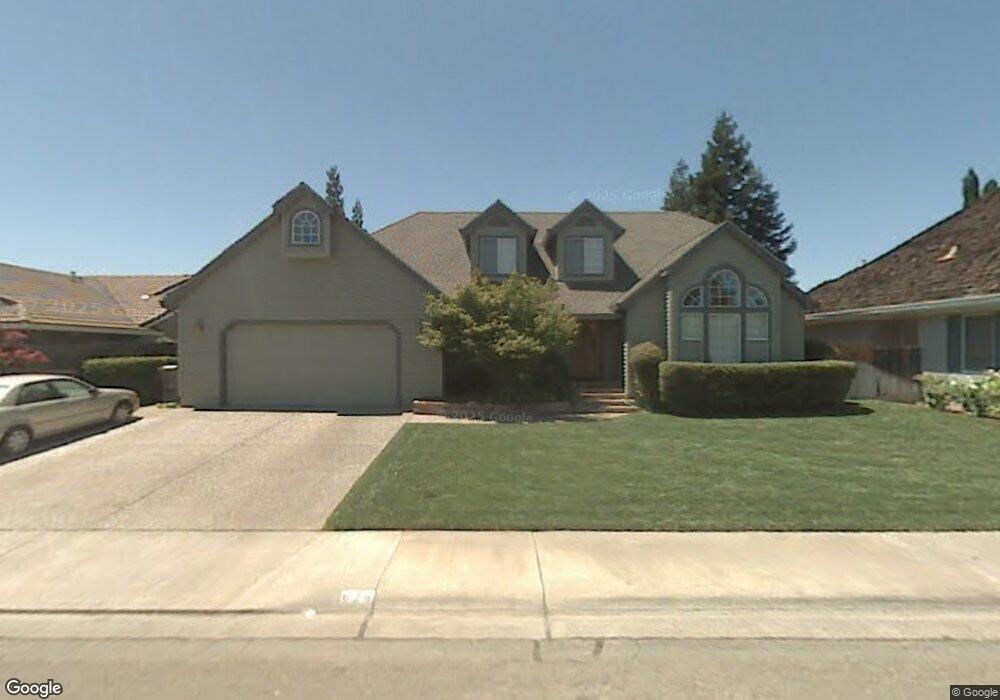
628 Fairview Dr Woodland, CA 95695
Estimated Value: $954,000 - $976,000
4
Beds
3
Baths
2,400
Sq Ft
$403/Sq Ft
Est. Value
About This Home
This home is located at 628 Fairview Dr, Woodland, CA 95695 and is currently estimated at $966,186, approximately $402 per square foot. 628 Fairview Dr is a home located in Yolo County with nearby schools including T.L. Whitehead Elementary School, Lee Middle School, and Woodland Senior High School.
Ownership History
Date
Name
Owned For
Owner Type
Purchase Details
Closed on
Feb 4, 2013
Sold by
Bucher Chris C and Bucher Deanna R
Bought by
Bucher Chris and Bucher Deanna
Current Estimated Value
Purchase Details
Closed on
Mar 18, 1998
Sold by
Low James D
Bought by
Bucher Chris C and Bucher Deanna R
Home Financials for this Owner
Home Financials are based on the most recent Mortgage that was taken out on this home.
Original Mortgage
$200,000
Outstanding Balance
$36,717
Interest Rate
7.06%
Estimated Equity
$929,469
Purchase Details
Closed on
Apr 11, 1994
Sold by
Silva Low Melinda
Bought by
Low James D
Home Financials for this Owner
Home Financials are based on the most recent Mortgage that was taken out on this home.
Original Mortgage
$134,000
Interest Rate
4.25%
Create a Home Valuation Report for This Property
The Home Valuation Report is an in-depth analysis detailing your home's value as well as a comparison with similar homes in the area
Home Values in the Area
Average Home Value in this Area
Purchase History
| Date | Buyer | Sale Price | Title Company |
|---|---|---|---|
| Bucher Chris | -- | None Available | |
| Bucher Chris C | $274,500 | North American Title Co | |
| Low James D | -- | First American Title Ins Co |
Source: Public Records
Mortgage History
| Date | Status | Borrower | Loan Amount |
|---|---|---|---|
| Open | Bucher Chris C | $200,000 | |
| Previous Owner | Low James D | $134,000 |
Source: Public Records
Tax History Compared to Growth
Tax History
| Year | Tax Paid | Tax Assessment Tax Assessment Total Assessment is a certain percentage of the fair market value that is determined by local assessors to be the total taxable value of land and additions on the property. | Land | Improvement |
|---|---|---|---|---|
| 2025 | $6,771 | $663,941 | $135,713 | $528,228 |
| 2023 | $6,771 | $638,161 | $130,444 | $507,717 |
| 2022 | $6,503 | $625,649 | $127,887 | $497,762 |
| 2021 | $6,398 | $613,382 | $125,380 | $488,002 |
| 2020 | $6,306 | $607,094 | $124,095 | $482,999 |
| 2019 | $6,186 | $595,191 | $121,662 | $473,529 |
| 2018 | $6,122 | $583,522 | $119,277 | $464,245 |
| 2017 | $5,969 | $570,317 | $116,939 | $453,378 |
| 2016 | $5,866 | $559,136 | $114,647 | $444,489 |
| 2015 | $5,667 | $550,738 | $112,925 | $437,813 |
| 2014 | $5,667 | $539,950 | $110,713 | $429,237 |
Source: Public Records
Map
Nearby Homes
- 956 W Cross St
- 725 Fairview Dr
- 742 W Cross St
- 805 W Lincoln Ave
- 737 Heather Ln
- 517 Daniels St
- 736 W Lincoln Ave Unit 138
- 637 Knollwood Dr
- 615 Knollwood Dr
- 633 Poplar Ln
- 1200 Evergreen Ct
- 420 W Southwood Dr
- 910 Notre Dame Dr
- 801-803 California St
- 628 California St
- 648 California St
- 754 Fordham Place
- 116 Imperial St
- 2 King Place
- 23 Azure Place
- 632 Fairview Dr
- 622 Fairview Dr
- 845 Wildwood Way
- 629 Wildwood Way
- 633 Wildwood Way
- 629 Fairview Dr
- 855 Wildwood Way
- 625 Fairview Dr
- 633 Fairview Dr
- 864 W Cross St
- 854 W Cross St
- 621 Fairview Dr
- 639 Wildwood Way
- 637 Fairview Dr
- 617 Fairview Dr
- 628 Ashley Ave
- 632 Ashley Ave
- 628 Wildwood Way
- 632 Wildwood Way
- 840 Wildwood Way