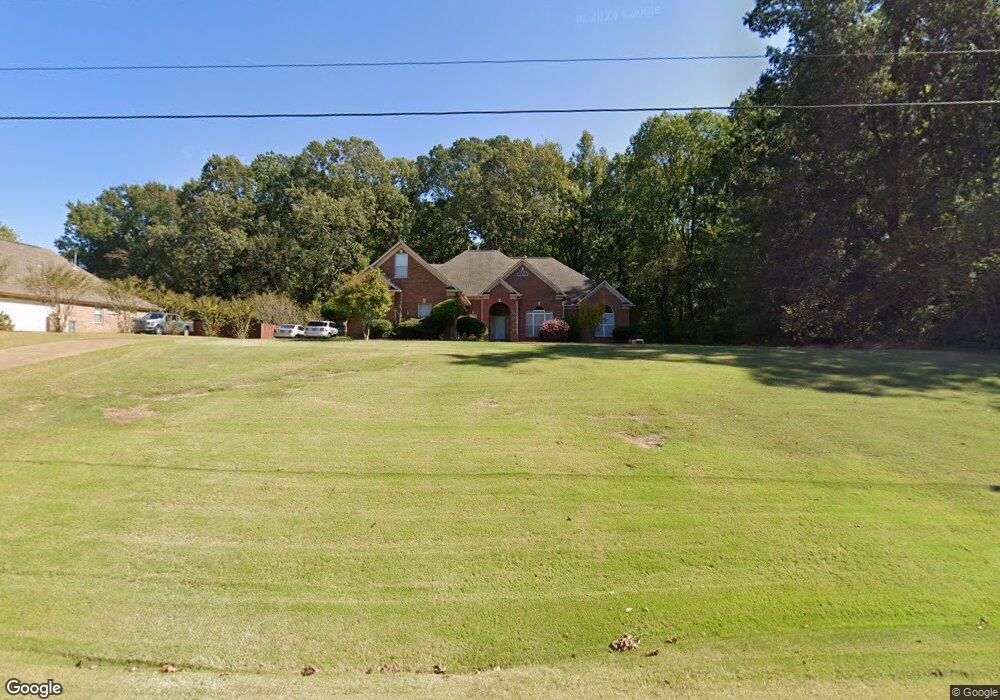
628 Mockingbird Dr Brighton, TN 38011
Estimated Value: $397,000 - $503,000
Studio
3
Baths
3,268
Sq Ft
$138/Sq Ft
Est. Value
About This Home
This home is located at 628 Mockingbird Dr, Brighton, TN 38011 and is currently estimated at $450,860, approximately $137 per square foot. 628 Mockingbird Dr is a home located in Tipton County with nearby schools including Austin Peay Elementary School, Brighton Middle School, and Brighton High School.
Ownership History
Date
Name
Owned For
Owner Type
Purchase Details
Closed on
Jul 17, 2020
Sold by
Four Js Enterprise Llc
Bought by
Payne William Earl and Payne Lawanda Jean
Current Estimated Value
Purchase Details
Closed on
Sep 6, 2014
Bought by
Payne William E and Payne Lawanda Jean
Purchase Details
Closed on
Nov 8, 1999
Sold by
R Cullum Const
Bought by
Payne William E
Home Financials for this Owner
Home Financials are based on the most recent Mortgage that was taken out on this home.
Original Mortgage
$215,423
Interest Rate
7.81%
Purchase Details
Closed on
Mar 22, 1999
Sold by
David Mcdivitt
Bought by
R Cullum Const
Purchase Details
Closed on
Nov 23, 1998
Sold by
Duffy Patrick H
Bought by
David Mcdivitt
Purchase Details
Closed on
Oct 20, 1997
Sold by
Munford Development
Bought by
Duffy Patrick H
Create a Home Valuation Report for This Property
The Home Valuation Report is an in-depth analysis detailing your home's value as well as a comparison with similar homes in the area
Purchase History
| Date | Buyer | Sale Price | Title Company |
|---|---|---|---|
| Payne William Earl | -- | None Available | |
| Payne William E | -- | -- | |
| Payne William E | $226,762 | -- | |
| R Cullum Const | $27,500 | -- | |
| David Mcdivitt | $26,500 | -- | |
| Duffy Patrick H | $20,000 | -- |
Source: Public Records
Mortgage History
| Date | Status | Borrower | Loan Amount |
|---|---|---|---|
| Previous Owner | Duffy Patrick H | $215,423 |
Source: Public Records
Tax History
| Year | Tax Paid | Tax Assessment Tax Assessment Total Assessment is a certain percentage of the fair market value that is determined by local assessors to be the total taxable value of land and additions on the property. | Land | Improvement |
|---|---|---|---|---|
| 2025 | $1,797 | $118,075 | $10,325 | $107,750 |
| 2024 | $1,797 | $118,075 | $10,325 | $107,750 |
| 2023 | $1,797 | $118,075 | $10,325 | $107,750 |
| 2022 | $1,681 | $82,425 | $7,600 | $74,825 |
| 2021 | $1,681 | $82,425 | $7,600 | $74,825 |
| 2020 | $1,681 | $82,425 | $7,600 | $74,825 |
| 2019 | $1,503 | $62,125 | $5,850 | $56,275 |
| 2018 | $1,503 | $62,125 | $5,850 | $56,275 |
| 2017 | $1,503 | $62,125 | $5,850 | $56,275 |
| 2016 | $1,503 | $62,125 | $5,850 | $56,275 |
| 2015 | $1,502 | $62,125 | $5,850 | $56,275 |
| 2014 | $1,501 | $62,110 | $0 | $0 |
Source: Public Records
Map
Nearby Homes
- 48 Stafford Rd
- 0 Harmon Cove
- 9485 Collierville Arlington Rd
- 9650 Collierville Arlington Rd
- 9958 Idaville Rd
- 7771 Hwy 14 Hwy S
- 7767 Hwy 14 Hwy S
- 143 Ashley Ln
- 360 Lyndsey Dr
- 230 Mcquiston Rd
- 60 Lyndsey Dr
- 8424 Old Memphis Rd
- 0 Osborntown Rd Unit 10208347
- 0 Gainsville Rd
- 41 Kingston Ave
- 262 Cheryl St
- 366 Kings Dr
- 165 Gilliam Ln
- 35 Catalpa Cove
- 10 Eureka Trail
- 596 Mockingbird Dr
- 564 Mockingbird Dr
- 621 Mockingbird Dr
- 65 Dogwood Dr
- 639 Mockingbird Dr
- 583 Mockingbird Dr
- 87 Dogwood Dr
- 26 Dogwood Dr
- 54 Dogwood Dr
- 691 Mockingbird Dr
- 515 Mockingbird Dr
- 82 Dogwood Dr
- 768 Mockingbird Dr
- 491 Mockingbird Dr
- 488 Mockingbird Dr
- 149 Dogwood Dr
- 771 Mockingbird Dr
- 460 Mockingbird Dr
- 110 Dogwood Dr
- 794 Mockingbird Dr
Your Personal Tour Guide
Ask me questions while you tour the home.