628 S Flower St Inglewood, CA 90301
Estimated Value: $796,000 - $1,005,000
3
Beds
2
Baths
2,050
Sq Ft
$436/Sq Ft
Est. Value
About This Home
This home is located at 628 S Flower St, Inglewood, CA 90301 and is currently estimated at $894,052, approximately $436 per square foot. 628 S Flower St is a home located in Los Angeles County with nearby schools including Kelso (William H.) Elementary School, Crozier (George W.) Middle School, and Morningside High School.
Ownership History
Date
Name
Owned For
Owner Type
Purchase Details
Closed on
Dec 16, 2002
Sold by
Delima Romildo B
Bought by
Davila Gladdy Alberto and Davila Iran
Current Estimated Value
Home Financials for this Owner
Home Financials are based on the most recent Mortgage that was taken out on this home.
Original Mortgage
$212,000
Interest Rate
5.93%
Purchase Details
Closed on
Jan 31, 2002
Sold by
Delima Ivete Queiroz Franca
Bought by
Delima Romildo B
Home Financials for this Owner
Home Financials are based on the most recent Mortgage that was taken out on this home.
Original Mortgage
$184,500
Interest Rate
7.04%
Purchase Details
Closed on
Dec 5, 2001
Sold by
Olsen Jan O
Bought by
Delima Romildo B
Home Financials for this Owner
Home Financials are based on the most recent Mortgage that was taken out on this home.
Original Mortgage
$184,500
Interest Rate
7.04%
Create a Home Valuation Report for This Property
The Home Valuation Report is an in-depth analysis detailing your home's value as well as a comparison with similar homes in the area
Home Values in the Area
Average Home Value in this Area
Purchase History
| Date | Buyer | Sale Price | Title Company |
|---|---|---|---|
| Davila Gladdy Alberto | $265,000 | Stewart Title Of Ca Inc | |
| Delima Romildo B | -- | Fidelity National Title Ins | |
| Delima Romildo B | $205,000 | Fidelity National Title Ins |
Source: Public Records
Mortgage History
| Date | Status | Borrower | Loan Amount |
|---|---|---|---|
| Previous Owner | Davila Gladdy Alberto | $212,000 | |
| Previous Owner | Delima Romildo B | $184,500 | |
| Closed | Davila Gladdy Alberto | $53,000 |
Source: Public Records
Tax History Compared to Growth
Tax History
| Year | Tax Paid | Tax Assessment Tax Assessment Total Assessment is a certain percentage of the fair market value that is determined by local assessors to be the total taxable value of land and additions on the property. | Land | Improvement |
|---|---|---|---|---|
| 2025 | $5,291 | $383,784 | $282,414 | $101,370 |
| 2024 | $5,291 | $376,260 | $276,877 | $99,383 |
| 2023 | $5,238 | $368,884 | $271,449 | $97,435 |
| 2022 | $5,326 | $361,652 | $266,127 | $95,525 |
| 2021 | $5,270 | $354,561 | $260,909 | $93,652 |
| 2020 | $5,047 | $350,926 | $258,234 | $92,692 |
| 2019 | $4,982 | $344,046 | $253,171 | $90,875 |
| 2018 | $4,825 | $337,301 | $248,207 | $89,094 |
| 2016 | $4,561 | $324,206 | $238,570 | $85,636 |
| 2015 | $4,520 | $319,337 | $234,987 | $84,350 |
| 2014 | $4,521 | $313,082 | $230,384 | $82,698 |
Source: Public Records
Map
Nearby Homes
- 614 Myrtle Ave
- 619 Myrtle Ave
- 621 S Osage Ave
- 218 E Tamarack Ave Unit 5
- 724 S Flower St
- 400 E Buckthorn St
- 320 E Spruce Ave
- 322 E Spruce Ave Unit E
- 721 Larch St Unit 11
- 430 E Spruce Ave Unit 77
- 435 E Tamarack Ave Unit 172
- 823 Java Ave Unit 11
- 523 Manchester Terrace Unit 5
- 110 E Hillcrest Blvd Unit 115
- 1035 Myrtle Ave
- 8726 Beckenham Ln Unit A
- 141 W Hillcrest Blvd Unit 2
- 8712 Chessington Dr Unit 255D
- 517 E 97th St
- 509 E 97th St
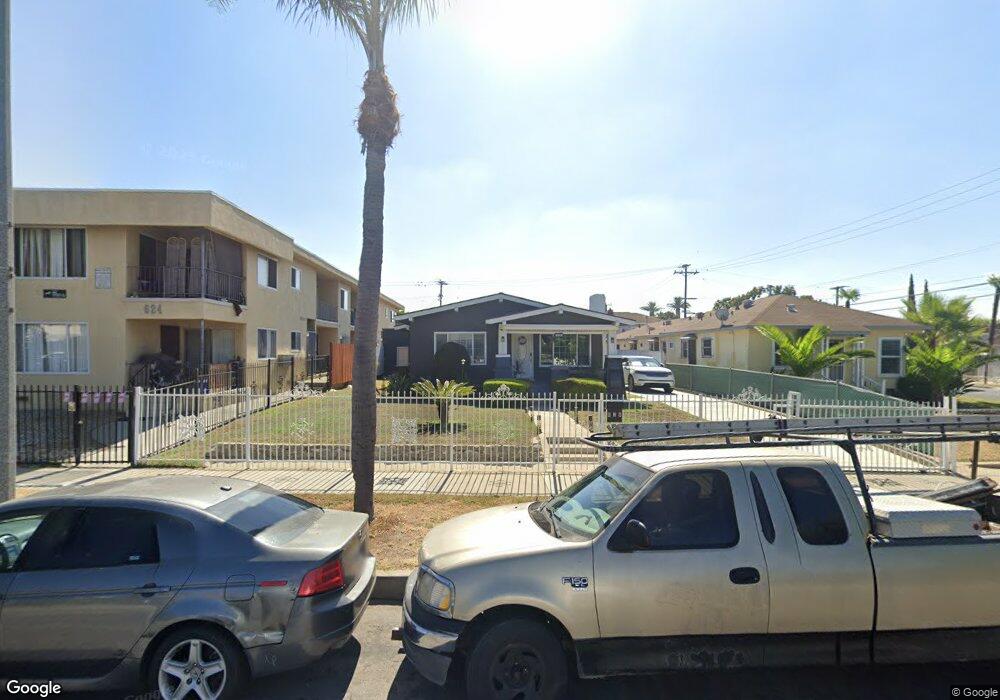
- 624 S Flower St
- 1108 E La Palma Dr
- 1112 E La Palma Dr
- 1112 La Brea Dr
- 1100 E La Palma Dr
- 612 S Flower St
- 629 S Osage Ave Unit 5
- 629 S Osage Ave
- 625 S Osage Ave Unit 1
- 625 S Osage Ave
- 629 S Flower St
- 635 S Flower St
- 633 S Osage Ave
- 706 S Flower St
- 1120 E La Palma Dr
- 608 S Flower St
- 617 S Osage Ave Unit 4
- 617 S Osage Ave Unit 5
- 617 S Osage Ave Unit 6
- 617 S Osage Ave Unit 1