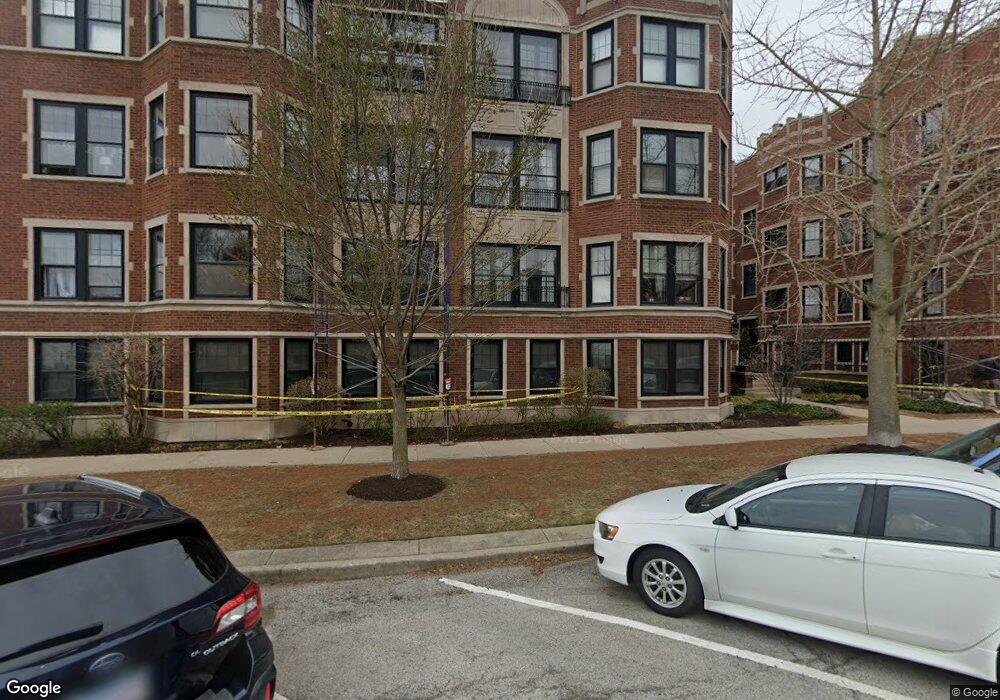
628 Sheridan Square Unit 6282 Evanston, IL 60202
Southeast Evanston NeighborhoodEstimated Value: $334,213 - $479,000
2
Beds
--
Bath
1,059
Sq Ft
$371/Sq Ft
Est. Value
About This Home
This home is located at 628 Sheridan Square Unit 6282, Evanston, IL 60202 and is currently estimated at $392,553, approximately $370 per square foot. 628 Sheridan Square Unit 6282 is a home located in Cook County with nearby schools including Lincoln Elementary School, Washington Elementary School, and Nichols Middle School.
Ownership History
Date
Name
Owned For
Owner Type
Purchase Details
Closed on
Mar 31, 2015
Sold by
Leblanc Dona Harris
Bought by
Sullivan Sharon M and Sharon M Sullivan Trust
Current Estimated Value
Purchase Details
Closed on
Aug 16, 2010
Sold by
Weiss Karen
Bought by
Le Blanc Dona Harris
Home Financials for this Owner
Home Financials are based on the most recent Mortgage that was taken out on this home.
Original Mortgage
$185,625
Interest Rate
4.49%
Mortgage Type
New Conventional
Purchase Details
Closed on
Nov 26, 1999
Sold by
Amcore Investment Group Na
Bought by
Klein Janet R
Home Financials for this Owner
Home Financials are based on the most recent Mortgage that was taken out on this home.
Original Mortgage
$174,400
Interest Rate
5.87%
Create a Home Valuation Report for This Property
The Home Valuation Report is an in-depth analysis detailing your home's value as well as a comparison with similar homes in the area
Home Values in the Area
Average Home Value in this Area
Purchase History
| Date | Buyer | Sale Price | Title Company |
|---|---|---|---|
| Sullivan Sharon M | $264,000 | Ct | |
| Le Blanc Dona Harris | $247,500 | Cti | |
| Klein Janet R | $218,000 | -- |
Source: Public Records
Mortgage History
| Date | Status | Borrower | Loan Amount |
|---|---|---|---|
| Previous Owner | Le Blanc Dona Harris | $185,625 | |
| Previous Owner | Klein Janet R | $174,400 |
Source: Public Records
Tax History Compared to Growth
Tax History
| Year | Tax Paid | Tax Assessment Tax Assessment Total Assessment is a certain percentage of the fair market value that is determined by local assessors to be the total taxable value of land and additions on the property. | Land | Improvement |
|---|---|---|---|---|
| 2024 | $4,680 | $22,648 | $1,826 | $20,822 |
| 2023 | $5,261 | $22,648 | $1,826 | $20,822 |
| 2022 | $5,261 | $22,648 | $1,826 | $20,822 |
| 2021 | $5,234 | $19,722 | $974 | $18,748 |
| 2020 | $5,164 | $19,722 | $974 | $18,748 |
| 2019 | $5,107 | $21,798 | $974 | $20,824 |
| 2018 | $5,174 | $18,886 | $821 | $18,065 |
| 2017 | $5,237 | $19,629 | $821 | $18,808 |
| 2016 | $5,467 | $21,601 | $821 | $20,780 |
| 2015 | $5,305 | $19,784 | $684 | $19,100 |
| 2014 | $4,085 | $19,784 | $684 | $19,100 |
| 2013 | -- | $24,731 | $684 | $24,047 |
Source: Public Records
Map
Nearby Homes
- 594 Sheridan Square Unit 3
- 628 Sheridan Square Unit 2
- 616 Michigan Ave Unit G
- 711 Michigan Ave
- 319 Kedzie St Unit 3E
- 321 Kedzie St Unit GND
- 840 Michigan Ave Unit 10
- 608 Hinman Ave Unit 4S
- 7756 N Sheridan Rd Unit 16
- 1628 W Juneway Terrace Unit 2W
- 1628 W Juneway Terrace Unit 1
- 835 Judson Ave Unit 305
- 847 Judson Ave Unit 2
- 7730 N Paulina St Unit 1
- 7708 N Ashland Ave
- 606B South Blvd
- 601 Linden Place Unit 116
- 811 Chicago Ave Unit 308
- 428 Callan Ave
- 645 Custer Ave Unit 103
- 622 Sheridan Square Unit 3
- 632 Sheridan Square Unit 6323
- 624 Sheridan Square Unit 6242
- 626 Sheridan Square Unit 6261
- 632 Sheridan Square Unit 6322
- 624 Sheridan Square Unit 6241
- 622 Sheridan Square Unit 6223
- 622 Sheridan Square Unit 6222
- 626 Sheridan Square Unit 620G
- 624 Sheridan Square Unit 6243
- 622 Sheridan Square Unit 6221
- 626 Sheridan Square Unit 6283
- 632 Sheridan Square Unit 6321
- 628 Sheridan Square Unit 6281
- 626 Sheridan Square Unit 6263
- 626 Sheridan Square Unit 6262
- 624 Sheridan Square Unit 3
- 632 Sheridan Square Unit 2
- 626 Sheridan Square Unit 2
- 622 Sheridan Square Unit 2