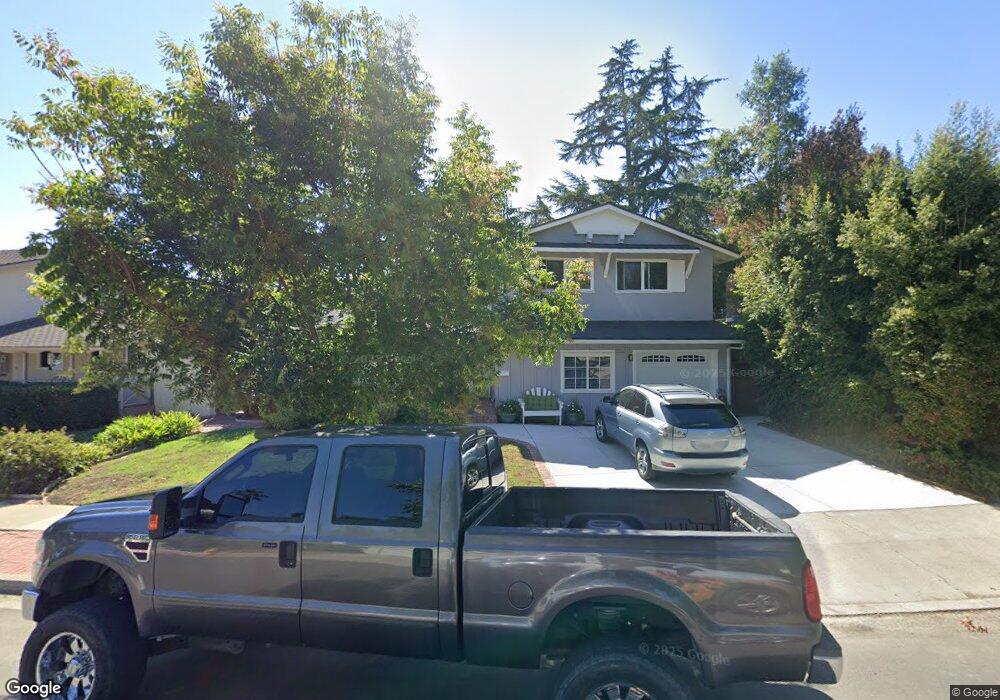
628 Stanford Dr San Luis Obispo, CA 93405
Highland NeighborhoodEstimated Value: $1,096,038 - $1,146,000
3
Beds
3
Baths
1,803
Sq Ft
$626/Sq Ft
Est. Value
About This Home
This home is located at 628 Stanford Dr, San Luis Obispo, CA 93405 and is currently estimated at $1,128,260, approximately $625 per square foot. 628 Stanford Dr is a home located in San Luis Obispo County with nearby schools including Bishop's Peak Elementary School, Laguna Middle School, and San Luis Obispo High School.
Ownership History
Date
Name
Owned For
Owner Type
Purchase Details
Closed on
Jan 5, 2012
Sold by
Keehn Rebecca R
Bought by
Keehn Rebecca R
Current Estimated Value
Home Financials for this Owner
Home Financials are based on the most recent Mortgage that was taken out on this home.
Original Mortgage
$305,000
Interest Rate
3.96%
Mortgage Type
New Conventional
Purchase Details
Closed on
May 13, 2010
Sold by
Keehn Rebecca
Bought by
Keehn Rebecca R
Purchase Details
Closed on
Oct 9, 2009
Sold by
Keehn Richard R
Bought by
Keehn Rebecca
Home Financials for this Owner
Home Financials are based on the most recent Mortgage that was taken out on this home.
Original Mortgage
$312,000
Interest Rate
5%
Mortgage Type
New Conventional
Purchase Details
Closed on
Dec 22, 2006
Sold by
Keehn Richard R and Keehn Rebecca R
Bought by
Keehn Richard R and Keehn Rebecca R
Create a Home Valuation Report for This Property
The Home Valuation Report is an in-depth analysis detailing your home's value as well as a comparison with similar homes in the area
Home Values in the Area
Average Home Value in this Area
Purchase History
| Date | Buyer | Sale Price | Title Company |
|---|---|---|---|
| Keehn Rebecca R | -- | Accommodation | |
| Keehn Rebecca R | -- | Fidelity National Title Co | |
| Keehn Rebecca R | -- | None Available | |
| Keehn Rebecca | -- | First American Title Company | |
| Keehn Richard R | -- | First American Title Company | |
| Keehn Richard R | -- | None Available |
Source: Public Records
Mortgage History
| Date | Status | Borrower | Loan Amount |
|---|---|---|---|
| Closed | Keehn Rebecca R | $305,000 | |
| Closed | Keehn Rebecca | $312,000 |
Source: Public Records
Tax History Compared to Growth
Tax History
| Year | Tax Paid | Tax Assessment Tax Assessment Total Assessment is a certain percentage of the fair market value that is determined by local assessors to be the total taxable value of land and additions on the property. | Land | Improvement |
|---|---|---|---|---|
| 2025 | $4,904 | $459,729 | $265,231 | $194,498 |
| 2024 | $4,814 | $450,716 | $260,031 | $190,685 |
| 2023 | $4,814 | $441,880 | $254,933 | $186,947 |
| 2022 | $4,510 | $433,217 | $249,935 | $183,282 |
| 2021 | $4,437 | $424,724 | $245,035 | $179,689 |
| 2020 | $4,391 | $420,370 | $242,523 | $177,847 |
| 2019 | $4,344 | $412,128 | $237,768 | $174,360 |
| 2018 | $4,257 | $404,048 | $233,106 | $170,942 |
| 2017 | $4,172 | $396,127 | $228,536 | $167,591 |
| 2016 | $4,089 | $388,360 | $224,055 | $164,305 |
| 2015 | $4,026 | $382,527 | $220,690 | $161,837 |
| 2014 | $3,695 | $375,034 | $216,367 | $158,667 |
Source: Public Records
Map
Nearby Homes
- 150 Los Robles Ct
- 133 N Tassajara Dr
- 231 Rosita St
- 411 E Foothill Blvd Unit 9
- 87 E Foothill Blvd
- 160 Broad St
- 60 Casa St
- 1185 E Foothill Blvd Unit 25
- 45 Stenner St Unit H
- 31 Hathway Ave
- 364 Hathway Ave
- 1213 Murray Ave
- 644 Mountain View St
- 441 Kentucky St
- 551 Hathway Ave
- 311 Longview Ln
- 879 Walnut St
- 670 Chorro St Unit D
- 1143 Walnut St
- 680 Chorro St Unit 5
- 634 Stanford Dr
- 620 Stanford Dr
- 577 Princeton Place
- 646 Stanford Dr
- 612 Stanford Dr
- 569 Princeton Place
- 621 Stanford Dr
- 613 Stanford Dr
- 583 Princeton Place
- 561 Princeton Place
- 588 Stanford Dr
- 635 Stanford Dr
- 599 Stanford Dr
- 652 Stanford Dr
- 667 Stanford Dr
- 553 Princeton Place
- 653 Stanford Dr
- 587 Stanford Dr
- 598 Princeton Place
- 572 Stanford Dr