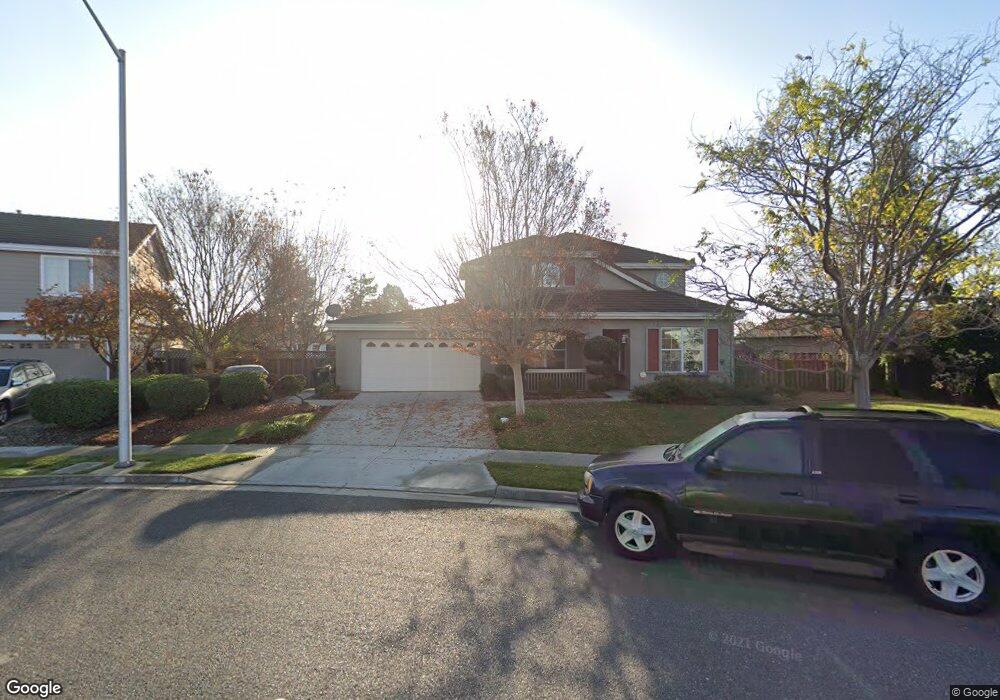
6280 Honeysuckle Dr Newark, CA 94560
Birch Grove NeighborhoodEstimated Value: $1,558,000 - $2,191,000
4
Beds
3
Baths
2,263
Sq Ft
$819/Sq Ft
Est. Value
About This Home
This home is located at 6280 Honeysuckle Dr, Newark, CA 94560 and is currently estimated at $1,854,266, approximately $819 per square foot. 6280 Honeysuckle Dr is a home located in Alameda County with nearby schools including Birch Grove Intermediate School, Newark Junior High School, and Newark Memorial High School.
Ownership History
Date
Name
Owned For
Owner Type
Purchase Details
Closed on
Mar 16, 2023
Sold by
Hill Ingrid A
Bought by
Ingrid A Hill 2023 Family Trust and Hill
Current Estimated Value
Purchase Details
Closed on
Jul 13, 2005
Sold by
Hill Ingrid A and Hylton Ingrid
Bought by
Hill Thomas J and Hill Ingrid A
Home Financials for this Owner
Home Financials are based on the most recent Mortgage that was taken out on this home.
Original Mortgage
$623,500
Interest Rate
5.55%
Mortgage Type
New Conventional
Purchase Details
Closed on
Feb 21, 2001
Sold by
Mardel Llc
Bought by
Hylton Ingrid
Home Financials for this Owner
Home Financials are based on the most recent Mortgage that was taken out on this home.
Original Mortgage
$520,807
Interest Rate
3.95%
Create a Home Valuation Report for This Property
The Home Valuation Report is an in-depth analysis detailing your home's value as well as a comparison with similar homes in the area
Home Values in the Area
Average Home Value in this Area
Purchase History
| Date | Buyer | Sale Price | Title Company |
|---|---|---|---|
| Ingrid A Hill 2023 Family Trust | -- | None Listed On Document | |
| Hill Thomas J | -- | Chicago Title Co | |
| Hylton Ingrid | $651,500 | Chicago Title Co |
Source: Public Records
Mortgage History
| Date | Status | Borrower | Loan Amount |
|---|---|---|---|
| Previous Owner | Hill Thomas J | $623,500 | |
| Previous Owner | Hylton Ingrid | $520,807 |
Source: Public Records
Tax History Compared to Growth
Tax History
| Year | Tax Paid | Tax Assessment Tax Assessment Total Assessment is a certain percentage of the fair market value that is determined by local assessors to be the total taxable value of land and additions on the property. | Land | Improvement |
|---|---|---|---|---|
| 2025 | $11,850 | $980,880 | $294,264 | $686,616 |
| 2024 | $11,850 | $961,650 | $288,495 | $673,155 |
| 2023 | $11,540 | $942,797 | $282,839 | $659,958 |
| 2022 | $11,409 | $924,315 | $277,294 | $647,021 |
| 2021 | $11,121 | $906,191 | $271,857 | $634,334 |
| 2020 | $11,014 | $896,901 | $269,070 | $627,831 |
| 2019 | $10,854 | $879,318 | $263,795 | $615,523 |
| 2018 | $10,697 | $862,080 | $258,624 | $603,456 |
| 2017 | $10,427 | $845,180 | $253,554 | $591,626 |
| 2016 | $10,332 | $828,611 | $248,583 | $580,028 |
| 2015 | $10,299 | $816,171 | $244,851 | $571,320 |
| 2014 | $8,841 | $701,000 | $210,300 | $490,700 |
Source: Public Records
Map
Nearby Homes
- 6429 Robertson Ave
- 6257 Honeysuckle Dr
- 6065 Robertson Ave
- 6176 Thomas Ave
- 6198 Civic Terrace Ave Unit A
- 37088 Arden St
- 5965 Moores Ave
- 38393 Amaryllis Place
- Ronda Plan at Marabel
- Sidonia Plan at Marabel
- Sierra Plan at Marabel
- Medina Plan at Marabel
- Olvera Plan at Marabel
- 6433 Thornton Ave
- 36976 Mulberry St
- 38466 Ambrosia St
- 38496 Ambrosia St
- 6189 Thornton Ave Unit C
- 36931 Newark Blvd Unit E
- 38532 Cedar Blvd
- 6272 Honeysuckle Dr
- 6296 Honeysuckle Dr
- 6277 Pomegranate Ave
- 6273 Honeysuckle Dr
- 6264 Honeysuckle Dr
- 37968 Lobelia Dr
- 37974 Lobelia Dr
- 6265 Pomegranate Ave
- 37912 Lobelia Dr
- 6302 Honeysuckle Dr
- 6265 Honeysuckle Dr
- 37796 Hyacinth St
- 6256 Honeysuckle Dr
- 37890 Lobelia Dr
- 6253 Pomegranate Ave
- 6292 Mistflower Ave
- 6288 Pomegranate Ave
- 6308 Honeysuckle Dr
- 37866 Lobelia Dr
- 6268 Mistflower Ave