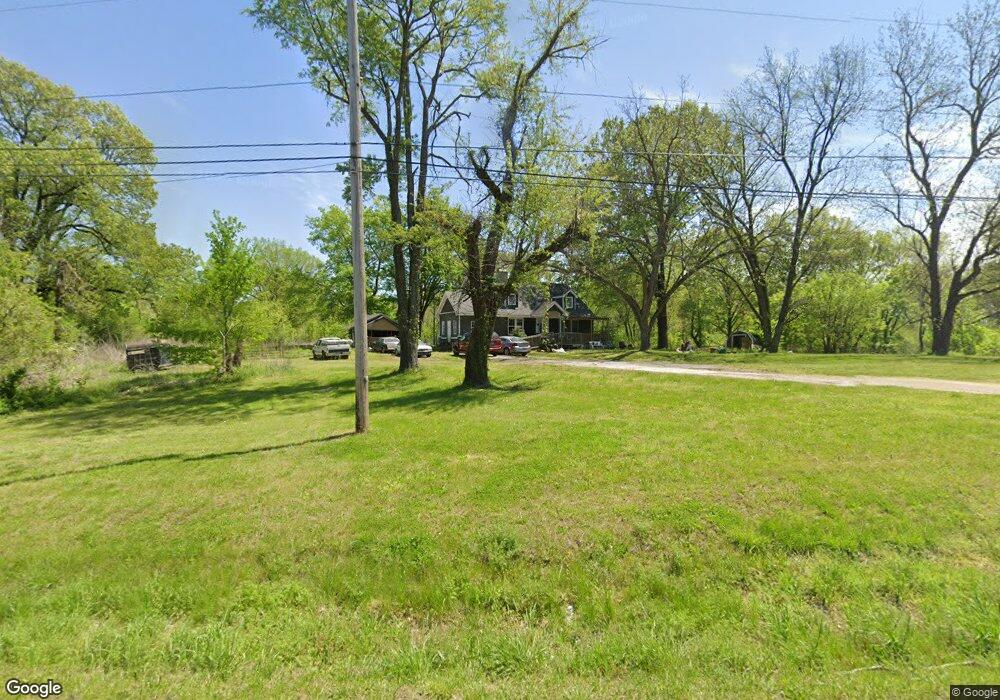
6282 Us Highway 51 N Millington, TN 38053
Estimated Value: $135,000 - $213,000
2
Beds
1
Bath
2,560
Sq Ft
$75/Sq Ft
Est. Value
About This Home
This home is located at 6282 Us Highway 51 N, Millington, TN 38053 and is currently estimated at $191,483, approximately $74 per square foot. 6282 Us Highway 51 N is a home located in Shelby County with nearby schools including Millington Elementary School, Millington High School, and Woodlawn Baptist Academy.
Ownership History
Date
Name
Owned For
Owner Type
Purchase Details
Closed on
Oct 18, 2023
Sold by
Brown George
Bought by
Kristina T Pham Revocable Living Trust and Pham
Current Estimated Value
Purchase Details
Closed on
Jun 17, 2014
Sold by
Malvezzi Frank
Bought by
Pham Kristina and Brown George
Purchase Details
Closed on
Oct 23, 2013
Sold by
Household Financial Center Inc
Bought by
Malvezzi Frank
Purchase Details
Closed on
Jun 11, 2013
Sold by
Hulsey John Richard and Thurman Christy Michelle
Bought by
Household Financial Center Inc
Purchase Details
Closed on
May 21, 2002
Sold by
Hulsey John Richard
Bought by
Hulsey John Richard and Thurman Christy Michelle
Home Financials for this Owner
Home Financials are based on the most recent Mortgage that was taken out on this home.
Original Mortgage
$64,900
Interest Rate
8.59%
Purchase Details
Closed on
Nov 19, 2001
Sold by
Hulsey Walter E
Bought by
Hulsey John
Create a Home Valuation Report for This Property
The Home Valuation Report is an in-depth analysis detailing your home's value as well as a comparison with similar homes in the area
Home Values in the Area
Average Home Value in this Area
Purchase History
| Date | Buyer | Sale Price | Title Company |
|---|---|---|---|
| Kristina T Pham Revocable Living Trust | -- | None Listed On Document | |
| Pham Kristina | $48,000 | None Available | |
| Malvezzi Frank | $29,900 | Us Title | |
| Household Financial Center Inc | $85,000 | None Available | |
| Hulsey John Richard | -- | Equity Title & Escrow Co | |
| Hulsey John | -- | -- |
Source: Public Records
Mortgage History
| Date | Status | Borrower | Loan Amount |
|---|---|---|---|
| Previous Owner | Hulsey John Richard | $64,900 |
Source: Public Records
Tax History Compared to Growth
Tax History
| Year | Tax Paid | Tax Assessment Tax Assessment Total Assessment is a certain percentage of the fair market value that is determined by local assessors to be the total taxable value of land and additions on the property. | Land | Improvement |
|---|---|---|---|---|
| 2025 | $1,089 | $41,575 | $12,925 | $28,650 |
| 2024 | $1,089 | $32,125 | $11,225 | $20,900 |
| 2023 | $1,089 | $32,125 | $11,225 | $20,900 |
| 2022 | $1,089 | $32,125 | $11,225 | $20,900 |
| 2021 | $1,108 | $32,125 | $11,225 | $20,900 |
| 2020 | $1,007 | $24,875 | $11,225 | $13,650 |
| 2019 | $1,007 | $24,875 | $11,225 | $13,650 |
| 2018 | $1,007 | $24,875 | $11,225 | $13,650 |
| 2017 | $1,022 | $24,875 | $11,225 | $13,650 |
| 2016 | $1,015 | $23,225 | $0 | $0 |
| 2014 | $1,015 | $23,225 | $0 | $0 |
Source: Public Records
Map
Nearby Homes
- 6639 Old Millington Rd
- 6746 Old Millington Rd
- 5907 Old Millington Rd
- 3545 Lucy Rd
- 2714 Moonview Rd
- 6968 Tennessee 3
- 4140 Pleasant Ridge Rd
- 3945 Crenshaw Rd
- 6234 Woodstock Cuba Rd
- 4578 Basun Cir E
- 4235 Sykes Rd
- 6866 Basun Cir E
- 5975 Prairie Cove
- 7265 Ward Rd
- 4469 Queen Sinclair Cir
- 4385 Ridge Bay Cove
- 4428 Duncan Rd
- 4551 Waverly Farms Rd
- 6770 Camp John Rd
- 4217 Sandy Hollow Ln
- 6282 Us 51 Hwy
- 6300 Us Highway 51 N
- 6318 Us Highway 51 N
- 6306 Us Highway 51 N
- 6309 Us Highway 51 N
- 6320 Us Highway 51 N
- 6320 Us 51
- 6242 Us Highway 51 N
- 6333 Friendship Church Rd
- 6325 Us 51 Hwy
- 6325 Us Highway 51 N
- 6340 Friendship Church Rd
- 6340 Us Highway 51 N
- 6358 Friendship Church Rd
- 6353 Friendship Church Rd
- 6353 Us Highway 51 N
- 6353 U S 51
- 6293 Friendship Church Rd
- 6351 Friendship Church Rd
- 6353 Us 51 Hwy N