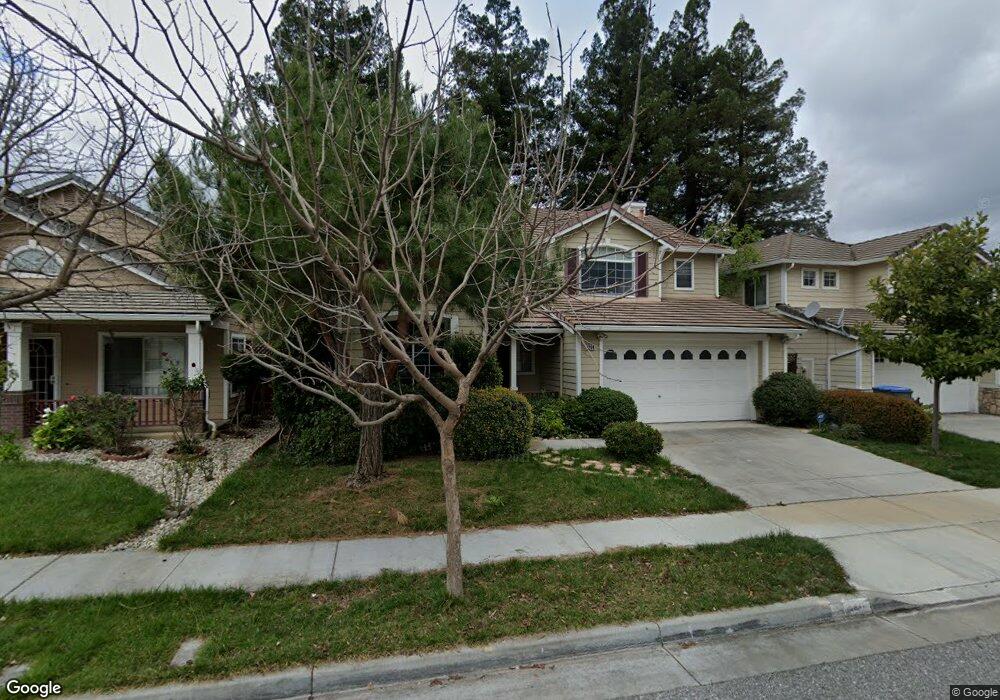
6284 Ginashell Cir San Jose, CA 95119
Rancho Santa Teresa NeighborhoodEstimated Value: $1,458,134 - $1,677,000
3
Beds
3
Baths
1,497
Sq Ft
$1,036/Sq Ft
Est. Value
About This Home
This home is located at 6284 Ginashell Cir, San Jose, CA 95119 and is currently estimated at $1,550,534, approximately $1,035 per square foot. 6284 Ginashell Cir is a home located in Santa Clara County with nearby schools including Santa Teresa Elementary School, Bernal Intermediate School, and Santa Teresa High School.
Ownership History
Date
Name
Owned For
Owner Type
Purchase Details
Closed on
Jan 24, 2008
Sold by
Guan Aiwen and Lee Victor F
Bought by
Lee Victor F
Current Estimated Value
Home Financials for this Owner
Home Financials are based on the most recent Mortgage that was taken out on this home.
Original Mortgage
$450,000
Outstanding Balance
$270,307
Interest Rate
5.25%
Mortgage Type
New Conventional
Estimated Equity
$1,280,227
Purchase Details
Closed on
Mar 11, 1999
Sold by
Barale Ronald J and Barale Marjoleine M
Bought by
Lee Victor F and Guan Aiwen
Home Financials for this Owner
Home Financials are based on the most recent Mortgage that was taken out on this home.
Original Mortgage
$308,400
Interest Rate
6.79%
Purchase Details
Closed on
Oct 28, 1996
Sold by
Kaufman & Broad South Bay Inc
Bought by
Barale Ronald J and Barale Marjoleine M
Home Financials for this Owner
Home Financials are based on the most recent Mortgage that was taken out on this home.
Original Mortgage
$197,000
Interest Rate
9.5%
Create a Home Valuation Report for This Property
The Home Valuation Report is an in-depth analysis detailing your home's value as well as a comparison with similar homes in the area
Home Values in the Area
Average Home Value in this Area
Purchase History
| Date | Buyer | Sale Price | Title Company |
|---|---|---|---|
| Lee Victor F | -- | Chicago Title Company | |
| Lee Victor F | $385,500 | Chicago Title Co | |
| Barale Ronald J | $299,000 | First American Title Guarant |
Source: Public Records
Mortgage History
| Date | Status | Borrower | Loan Amount |
|---|---|---|---|
| Open | Lee Victor F | $450,000 | |
| Closed | Lee Victor F | $308,400 | |
| Previous Owner | Barale Ronald J | $197,000 |
Source: Public Records
Tax History
| Year | Tax Paid | Tax Assessment Tax Assessment Total Assessment is a certain percentage of the fair market value that is determined by local assessors to be the total taxable value of land and additions on the property. | Land | Improvement |
|---|---|---|---|---|
| 2025 | $8,913 | $604,336 | $188,115 | $416,221 |
| 2024 | $8,913 | $592,487 | $184,427 | $408,060 |
| 2023 | $8,760 | $580,870 | $180,811 | $400,059 |
| 2022 | $8,700 | $569,481 | $177,266 | $392,215 |
| 2021 | $8,552 | $558,316 | $173,791 | $384,525 |
| 2020 | $8,351 | $552,592 | $172,009 | $380,583 |
| 2019 | $8,149 | $541,758 | $168,637 | $373,121 |
| 2018 | $8,083 | $531,136 | $165,331 | $365,805 |
| 2017 | $7,970 | $520,723 | $162,090 | $358,633 |
| 2016 | $7,585 | $510,513 | $158,912 | $351,601 |
| 2015 | $7,406 | $502,845 | $156,525 | $346,320 |
| 2014 | $6,737 | $492,996 | $153,459 | $339,537 |
Source: Public Records
Map
Nearby Homes
- 6121 Lambeck Ln Unit 972
- 890 White Moonstone Loop
- 5951 Sunstone Dr Unit 208
- 815 Blue Opal Dr
- 6060 Charlotte Dr
- 6063 Raleigh Rd
- 5925 Charlotte Dr Unit 212
- 6147 Camino Verde Dr Unit A
- 5886 Smoky Quartz Loop
- 5740 Vibrant Loop
- 5968 Virtual Ct
- 6575 Kaneko Dr
- 5948 Sage Dr
- 6694 Optimum Loop
- 6702 Optimum Loop
- 6710 Optimum Loop
- 313 Oakberry Way
- 134 Herlong Ave
- 6075 Bigelow Ct
- 332 Oakberry Way
- 6288 Ginashell Cir
- 6280 Ginashell Cir
- 6204 Ginashell Cir
- 6200 Ginashell Cir
- 6208 Ginashell Cir
- 6276 Ginashell Cir
- 170 Cheryl Beck Dr
- 174 Cheryl Beck Dr
- 6212 Ginashell Cir
- 6281 Ginashell Cir
- 6285 Ginashell Cir
- 178 Cheryl Beck Dr
- 6277 Ginashell Cir
- 6272 Ginashell Cir
- 6289 Ginashell Cir
- 6216 Ginashell Cir
- 6273 Ginashell Cir
- 6268 Ginashell Cir
- 182 Cheryl Beck Dr
- 6240 Yeadon Way