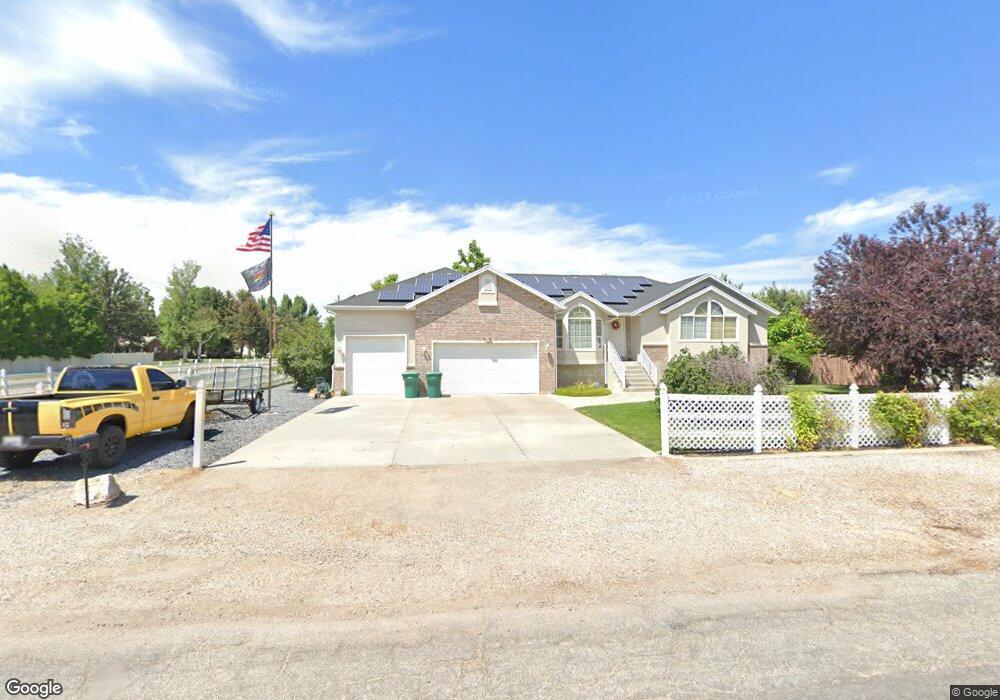
6284 W 4800 S Hooper, UT 84315
Estimated Value: $667,000 - $792,000
3
Beds
2
Baths
3,180
Sq Ft
$226/Sq Ft
Est. Value
About This Home
This home is located at 6284 W 4800 S, Hooper, UT 84315 and is currently estimated at $718,119, approximately $225 per square foot. 6284 W 4800 S is a home located in Weber County with nearby schools including Hooper Elementary School, Rocky Mountain Junior High School, and Quest Academy.
Ownership History
Date
Name
Owned For
Owner Type
Purchase Details
Closed on
Jul 21, 2016
Sold by
Richey Jeff and Richey Janell
Bought by
Richey Jeffrey Arnold
Current Estimated Value
Purchase Details
Closed on
Apr 12, 2000
Sold by
Construction Specialists Lc
Bought by
Richey Jeff and Richey Janell
Home Financials for this Owner
Home Financials are based on the most recent Mortgage that was taken out on this home.
Original Mortgage
$195,000
Outstanding Balance
$66,950
Interest Rate
8.26%
Mortgage Type
Seller Take Back
Estimated Equity
$651,169
Purchase Details
Closed on
Jul 28, 1999
Sold by
Thomas S Lowe Subdivision Inc
Bought by
Construction Specialists Lc
Home Financials for this Owner
Home Financials are based on the most recent Mortgage that was taken out on this home.
Original Mortgage
$165,000
Interest Rate
7.64%
Create a Home Valuation Report for This Property
The Home Valuation Report is an in-depth analysis detailing your home's value as well as a comparison with similar homes in the area
Home Values in the Area
Average Home Value in this Area
Purchase History
| Date | Buyer | Sale Price | Title Company |
|---|---|---|---|
| Richey Jeffrey Arnold | -- | None Available | |
| Richey Jeff | -- | Bonneville Title | |
| Construction Specialists Lc | -- | Cardon Metro Title Company |
Source: Public Records
Mortgage History
| Date | Status | Borrower | Loan Amount |
|---|---|---|---|
| Open | Richey Jeff | $195,000 | |
| Previous Owner | Construction Specialists Lc | $165,000 | |
| Closed | Construction Specialists Lc | $28,000 |
Source: Public Records
Tax History
| Year | Tax Paid | Tax Assessment Tax Assessment Total Assessment is a certain percentage of the fair market value that is determined by local assessors to be the total taxable value of land and additions on the property. | Land | Improvement |
|---|---|---|---|---|
| 2025 | $93 | $718,616 | $216,715 | $501,901 |
| 2024 | $66 | $390,112 | $119,193 | $270,919 |
| 2023 | $68 | $377,527 | $119,329 | $258,198 |
| 2022 | $1,070 | $386,650 | $103,249 | $283,401 |
| 2021 | $73 | $492,999 | $95,385 | $397,614 |
| 2020 | $80 | $456,000 | $76,401 | $379,599 |
| 2019 | $76 | $440,000 | $72,582 | $367,418 |
| 2018 | $1,491 | $439,000 | $72,582 | $366,418 |
| 2017 | $2,988 | $395,000 | $58,709 | $336,291 |
| 2016 | $3,025 | $218,630 | $32,404 | $186,226 |
| 2015 | $2,945 | $209,762 | $32,404 | $177,358 |
| 2014 | $2,713 | $187,981 | $32,404 | $155,577 |
Source: Public Records
Map
Nearby Homes
- 6036 W 4700 S
- 3729 S 5600 W Unit 6
- 3720 S 5600 W Unit 2
- 3732 S 5600 W Unit 3
- 3719 S 5600 W Unit 7
- 4129 S 5800 W Unit 4
- 4146 S 5800 W Unit 5
- 4194 S 5800 W Unit 14
- 4168 S 5800 W Unit 12
- 4179 S 5800 W Unit 1
- 4163 S 5800 W Unit 2
- 0 W 5500 S
- 5577 W 4000 S
- 3842 S 5675 W
- 4111 S 5350 W
- 5335 W 5500 S
- 3706 S 5650 W Unit 9
- 4836 S 5050 W
- 3691 S 5600 W Unit 20
- 3632 S 5400 W