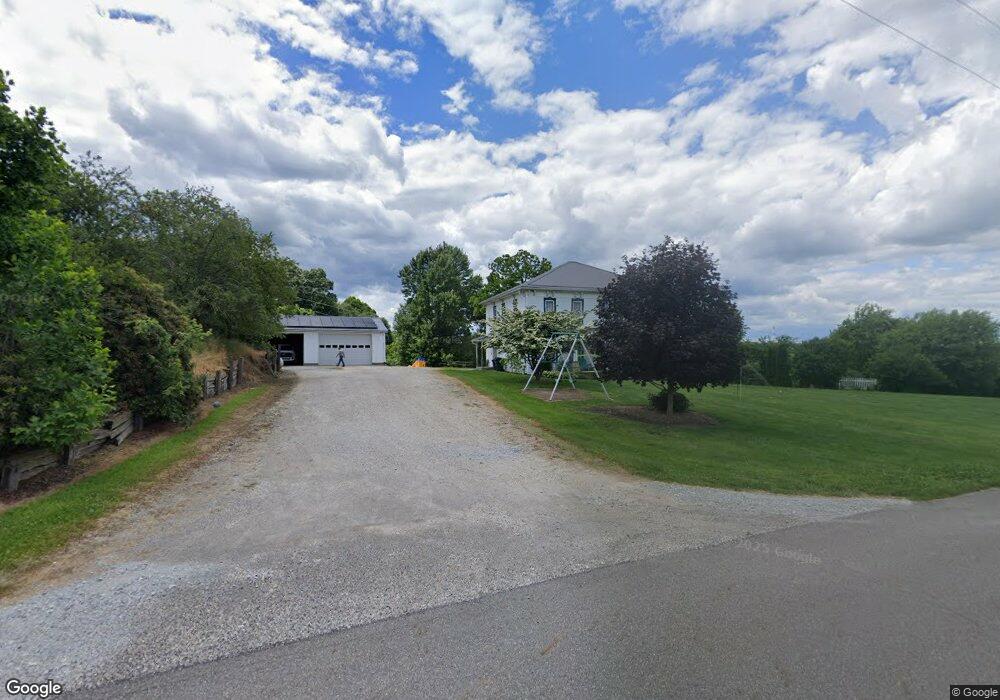
6287 Desert Rd SW Unit 7 Carrollton, OH 44615
Estimated Value: $268,000 - $338,962
4
Beds
2
Baths
2,800
Sq Ft
$110/Sq Ft
Est. Value
About This Home
This home is located at 6287 Desert Rd SW Unit 7, Carrollton, OH 44615 and is currently estimated at $308,241, approximately $110 per square foot. 6287 Desert Rd SW Unit 7 is a home located in Carroll County with nearby schools including Carrollton High School.
Ownership History
Date
Name
Owned For
Owner Type
Purchase Details
Closed on
Jul 16, 2013
Sold by
Joseph Asset Management Company Llc
Bought by
Gairo Francis J and Gairo Angela J
Current Estimated Value
Home Financials for this Owner
Home Financials are based on the most recent Mortgage that was taken out on this home.
Original Mortgage
$125,000
Outstanding Balance
$90,855
Interest Rate
3.91%
Mortgage Type
Purchase Money Mortgage
Estimated Equity
$217,386
Purchase Details
Closed on
Apr 20, 2012
Sold by
Joseph Asset Management Company Llc
Bought by
Black Gold Holdings Llc
Purchase Details
Closed on
Jan 18, 2011
Sold by
Federal Home Loan Mortgage Corporation
Bought by
Joseph Kenneth J
Purchase Details
Closed on
Aug 31, 2010
Sold by
Brown Richard W
Bought by
Federal Home Loan Mortgage Corporation
Purchase Details
Closed on
Apr 14, 2010
Sold by
Brown Richard W
Bought by
Federal Home Loan Mortgage Corporation
Create a Home Valuation Report for This Property
The Home Valuation Report is an in-depth analysis detailing your home's value as well as a comparison with similar homes in the area
Home Values in the Area
Average Home Value in this Area
Purchase History
| Date | Buyer | Sale Price | Title Company |
|---|---|---|---|
| Gairo Francis J | $100,000 | Community Title | |
| Black Gold Holdings Llc | -- | Attorney | |
| Joseph Kenneth J | $44,900 | None Available | |
| Federal Home Loan Mortgage Corporation | $75,761 | None Available | |
| Federal Home Loan Mortgage Corporation | $75,761 | None Available |
Source: Public Records
Mortgage History
| Date | Status | Borrower | Loan Amount |
|---|---|---|---|
| Open | Gairo Francis J | $125,000 |
Source: Public Records
Tax History Compared to Growth
Tax History
| Year | Tax Paid | Tax Assessment Tax Assessment Total Assessment is a certain percentage of the fair market value that is determined by local assessors to be the total taxable value of land and additions on the property. | Land | Improvement |
|---|---|---|---|---|
| 2024 | $2,679 | $81,550 | $11,890 | $69,660 |
| 2023 | $2,660 | $81,550 | $11,890 | $69,660 |
| 2022 | $2,641 | $64,770 | $9,860 | $54,910 |
| 2021 | $2,184 | $64,770 | $9,860 | $54,910 |
| 2020 | $2,033 | $63,560 | $9,860 | $53,700 |
| 2019 | $2,012 | $63,560 | $9,863 | $53,697 |
| 2018 | $1,572 | $48,190 | $7,680 | $40,510 |
| 2017 | $1,573 | $48,190 | $7,680 | $40,510 |
| 2016 | $1,531 | $42,090 | $7,050 | $35,040 |
| 2015 | $1,361 | $42,090 | $7,050 | $35,040 |
| 2014 | $1,362 | $42,090 | $7,050 | $35,040 |
| 2013 | $1,350 | $42,090 | $7,050 | $35,040 |
Source: Public Records
Map
Nearby Homes
- 2227 Elk Rd SW Unit 14A
- 1121 Center St SW
- 5140 Pinto Rd SE
- 8013 & 8019 East St SW
- 7822 Hilltop Dr NW
- 8125 Scio Rd SE Unit 35
- 1045 Amsterdam Rd SE Unit 30
- 6090 Revere Rd SW
- 8116 Deer Rd SW Unit 29B3
- 2245 Scroll Rd SW Unit 17
- 0 Aster Rd Unit 5154135
- 0 Deer Rd SW
- 91510 Amos Rd
- 2081 Antigua Rd SW Unit 17
- 9218 Deacon Rd SW
- 91240 Kilgore Ridge Rd Unit 47
- 3145 Steubenville Rd SE Unit 16
- 90480 Kilgore Ridge Rd
- 144 Arrow Rd SW Unit 19
- 47 Cr Laverty 47 Dr
- 1140 Dyewood Rd SW Unit 7
- 6250 Desert Rd SW Unit 7
- 6380 Desert Rd SW Unit 7
- 6187 Desert Rd SW Unit 7
- 6538 Desert Rd SW Unit 7
- 1227 Dyewood Rd SW Unit 7
- 5248 Desert Rd SW Unit 8
- 6740 Desert Rd SW Unit 7
- 1277 Dyewood Rd SW Unit 7
- 6861 Desert Rd SW Unit 7
- 5224 Desert Rd SW Unit 8
- 250 Dyewood Rd SW Unit 1
- 259 Dyewood Rd SW Unit 1
- 5180 Desert Rd SW Unit 8
- 5167 Desert Rd SW Unit 8
- 5170 Desert Rd SW
- 5214 Doral Rd SW Unit 8
- 241 Dyewood Rd SW Unit 1
- 5157 Desert Rd SW Unit 8
- 6005 Scio Rd SW Unit 1