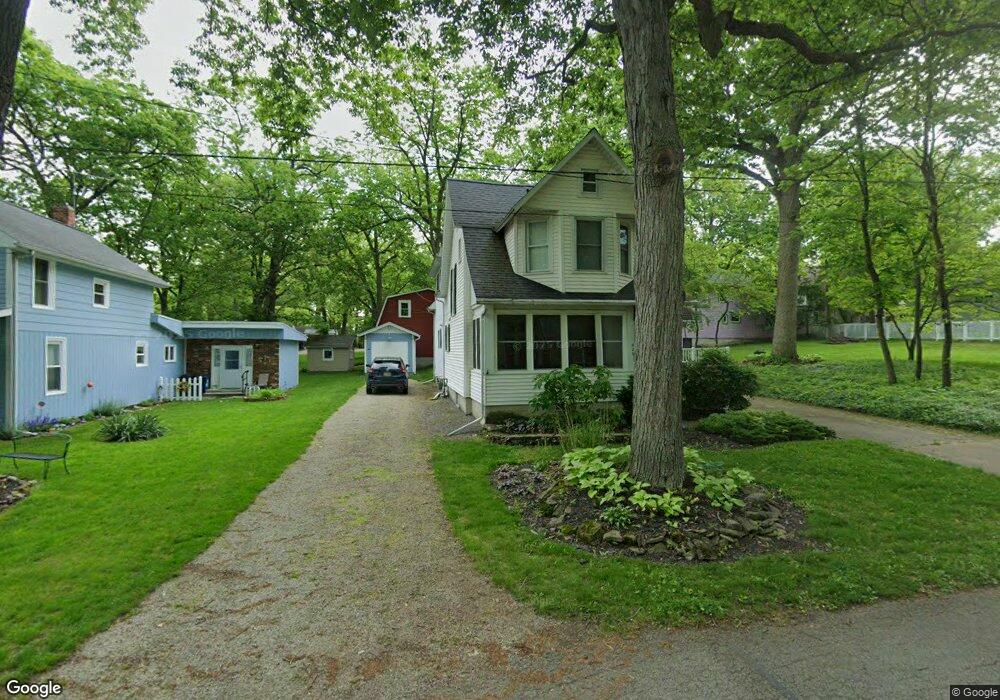
629 Cedar Ave Lakeside Marblehead, OH 43440
Estimated Value: $732,162 - $912,000
3
Beds
3
Baths
1,998
Sq Ft
$412/Sq Ft
Est. Value
About This Home
This home is located at 629 Cedar Ave, Lakeside Marblehead, OH 43440 and is currently estimated at $823,291, approximately $412 per square foot. 629 Cedar Ave is a home located in Ottawa County with nearby schools including Danbury Middle School and Danbury High School.
Ownership History
Date
Name
Owned For
Owner Type
Purchase Details
Closed on
Aug 23, 2012
Sold by
Turner Elizabeth J
Bought by
Ludwig Matthew James and Ludwig Heather Ann
Current Estimated Value
Home Financials for this Owner
Home Financials are based on the most recent Mortgage that was taken out on this home.
Original Mortgage
$324,000
Outstanding Balance
$222,863
Interest Rate
3.52%
Mortgage Type
New Conventional
Estimated Equity
$600,428
Purchase Details
Closed on
Feb 9, 2007
Sold by
Heckenhauer Janice W
Bought by
Heckenhauer Janice W and Turner Elizabeth J
Create a Home Valuation Report for This Property
The Home Valuation Report is an in-depth analysis detailing your home's value as well as a comparison with similar homes in the area
Home Values in the Area
Average Home Value in this Area
Purchase History
| Date | Buyer | Sale Price | Title Company |
|---|---|---|---|
| Ludwig Matthew James | $408,000 | Attorney | |
| Heckenhauer Janice W | -- | Attorney | |
| Heckenhauer Janice W | -- | Attorney |
Source: Public Records
Mortgage History
| Date | Status | Borrower | Loan Amount |
|---|---|---|---|
| Open | Ludwig Matthew James | $324,000 |
Source: Public Records
Tax History
| Year | Tax Paid | Tax Assessment Tax Assessment Total Assessment is a certain percentage of the fair market value that is determined by local assessors to be the total taxable value of land and additions on the property. | Land | Improvement |
|---|---|---|---|---|
| 2024 | $8,459 | $247,192 | $112,018 | $135,174 |
| 2023 | $8,425 | $161,466 | $53,172 | $108,294 |
| 2022 | $5,574 | $161,466 | $53,172 | $108,294 |
| 2021 | $5,591 | $161,460 | $53,170 | $108,290 |
| 2020 | $4,972 | $135,890 | $52,130 | $83,760 |
| 2019 | $4,601 | $135,890 | $52,130 | $83,760 |
| 2018 | $4,595 | $135,890 | $52,130 | $83,760 |
| 2017 | $4,725 | $138,330 | $59,680 | $78,650 |
| 2016 | $4,678 | $138,330 | $59,680 | $78,650 |
| 2015 | $4,694 | $138,330 | $59,680 | $78,650 |
| 2014 | $2,357 | $135,740 | $59,680 | $76,060 |
| 2013 | $2,188 | $135,740 | $59,680 | $76,060 |
Source: Public Records
Map
Nearby Homes
- 212 E 7th St
- 721 Laurel Ave
- 132 E 4th St
- 336 Peach Ave
- 317 Maple Ave Unit 17
- 446 Lynn Ave
- 317 Oak Ave
- 224 Oak Ave
- 1209 Prairie St
- 5486 E Harbor Rd
- 269 Lighthouse Oval
- 282 N Lighthouse Oval
- 280 N Lighthouse Oval
- 281 N Lighthouse Oval
- 275 N Lighthouse Oval
- 385 Hidden Beach Rd
- 347 Hidden Beach Rd
- 0 S Harbor Bay Dr Unit 20210331
- 271 Willowdale Dr
- 8335 E Reserve Way
Your Personal Tour Guide
Ask me questions while you tour the home.