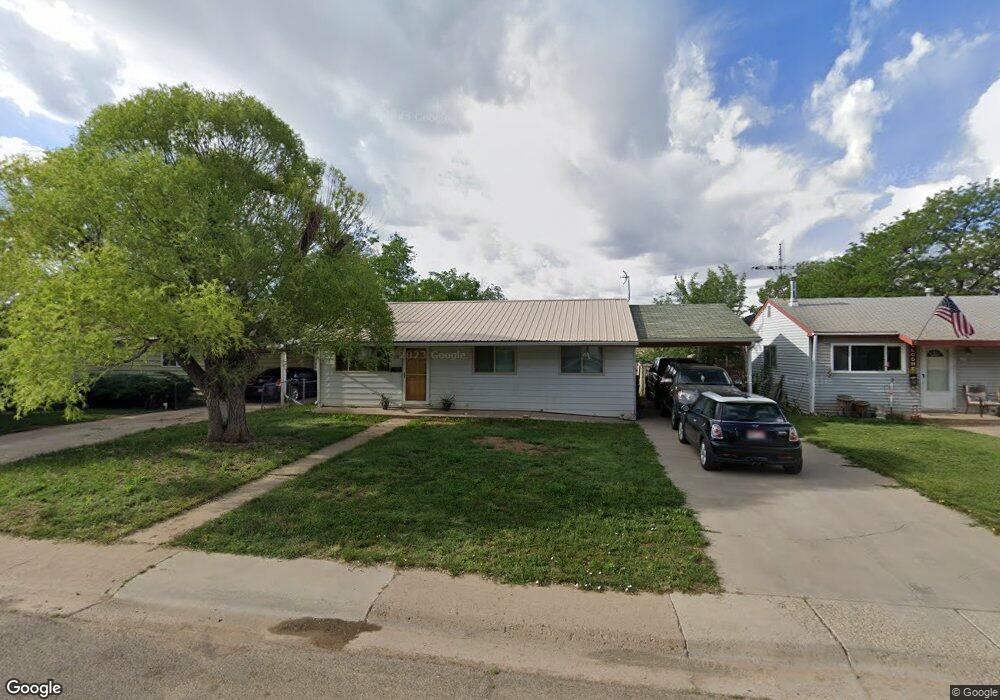
629 E 3rd St Cortez, CO 81321
Estimated Value: $233,000 - $264,000
3
Beds
1
Bath
900
Sq Ft
$270/Sq Ft
Est. Value
About This Home
This home is located at 629 E 3rd St, Cortez, CO 81321 and is currently estimated at $242,886, approximately $269 per square foot. 629 E 3rd St is a home with nearby schools including Montezuma-Cortez High School, Children's Kiva Montessori School, and Children's Kiva Montessori Preschool & Kindergarten.
Ownership History
Date
Name
Owned For
Owner Type
Purchase Details
Closed on
Mar 8, 2018
Sold by
County Of Montezuma
Bought by
West George E
Current Estimated Value
Purchase Details
Closed on
Aug 6, 2012
Sold by
West George E
Bought by
West George E
Purchase Details
Closed on
Mar 11, 2005
Sold by
West Jesse Vincent
Bought by
West Jesse Vincent and West George E
Create a Home Valuation Report for This Property
The Home Valuation Report is an in-depth analysis detailing your home's value as well as a comparison with similar homes in the area
Purchase History
| Date | Buyer | Sale Price | Title Company |
|---|---|---|---|
| West George E | -- | None Available | |
| West George E | -- | None Available | |
| West Jesse Vincent | -- | None Available |
Source: Public Records
Tax History
| Year | Tax Paid | Tax Assessment Tax Assessment Total Assessment is a certain percentage of the fair market value that is determined by local assessors to be the total taxable value of land and additions on the property. | Land | Improvement |
|---|---|---|---|---|
| 2024 | $765 | $10,782 | $2,046 | $8,736 |
| 2023 | $554 | $15,159 | $2,876 | $12,283 |
| 2022 | $493 | $10,202 | $1,313 | $8,889 |
| 2021 | $502 | $10,202 | $1,313 | $8,889 |
| 2020 | $422 | $8,910 | $1,445 | $7,465 |
| 2019 | $423 | $8,910 | $1,445 | $7,465 |
| 2018 | $404 | $6,340 | $1,310 | $5,030 |
| 2017 | $402 | $6,340 | $1,310 | $5,030 |
| 2016 | $355 | $6,180 | $1,440 | $4,740 |
| 2015 | $326 | $90,090 | $0 | $0 |
| 2014 | $379 | $6,180 | $0 | $0 |
Source: Public Records
Map
Nearby Homes
Your Personal Tour Guide
Ask me questions while you tour the home.