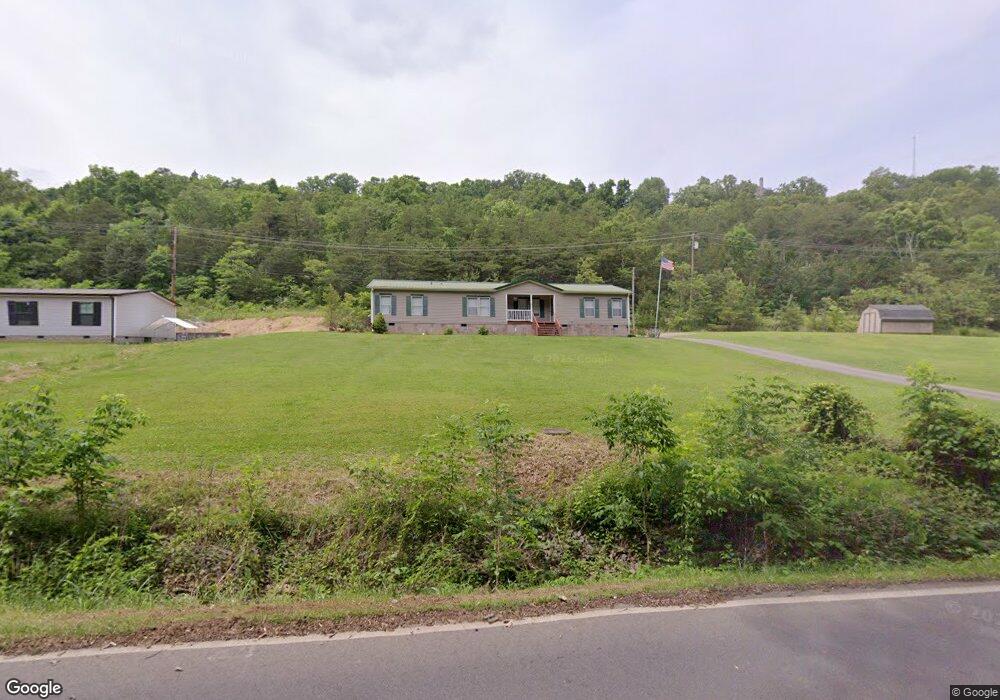
629 Fish Hatchery Rd Morristown, TN 37813
Estimated Value: $204,000 - $254,000
--
Bed
2
Baths
1,680
Sq Ft
$135/Sq Ft
Est. Value
About This Home
This home is located at 629 Fish Hatchery Rd, Morristown, TN 37813 and is currently estimated at $227,048, approximately $135 per square foot. 629 Fish Hatchery Rd is a home located in Hamblen County with nearby schools including Hillcrest Elementary School, Meadowview Middle School, and Morristown East High School.
Ownership History
Date
Name
Owned For
Owner Type
Purchase Details
Closed on
Dec 14, 2012
Sold by
Pratt Malcolm
Bought by
Pratt Christine
Current Estimated Value
Purchase Details
Closed on
Mar 10, 2005
Bought by
Pratt Malcolm D and Pratt Christine
Purchase Details
Closed on
Dec 19, 2003
Sold by
Evans S J
Bought by
Pratt Malcolm
Purchase Details
Closed on
Oct 23, 2003
Bought by
Pratt Malcolm D and Pratt Christine
Purchase Details
Closed on
Oct 23, 2002
Bought by
Evans Robert and Evans Michael
Purchase Details
Closed on
Aug 20, 2002
Bought by
Evans S J S and Evans Kay
Purchase Details
Closed on
Jun 4, 2002
Sold by
Robert Evans
Bought by
Pratt Malcolm
Home Financials for this Owner
Home Financials are based on the most recent Mortgage that was taken out on this home.
Original Mortgage
$69,900
Interest Rate
6.77%
Purchase Details
Closed on
Jan 6, 1999
Bought by
Taylor Evelyn
Purchase Details
Closed on
Apr 2, 1982
Bought by
Joyce Verna M
Purchase Details
Closed on
Aug 29, 1980
Bought by
Combs Phillip and Combs Sheila
Create a Home Valuation Report for This Property
The Home Valuation Report is an in-depth analysis detailing your home's value as well as a comparison with similar homes in the area
Home Values in the Area
Average Home Value in this Area
Purchase History
| Date | Buyer | Sale Price | Title Company |
|---|---|---|---|
| Pratt Christine | -- | -- | |
| Pratt Malcolm D | $1,000 | -- | |
| Pratt Malcolm | $18,000 | -- | |
| Pratt Malcolm D | $300 | -- | |
| Evans Robert | -- | -- | |
| Evans S J S | $17,500 | -- | |
| Pratt Malcolm | $79,900 | -- | |
| Taylor Evelyn | $47,000 | -- | |
| Joyce Verna M | $6,300 | -- | |
| Combs Phillip | -- | -- |
Source: Public Records
Mortgage History
| Date | Status | Borrower | Loan Amount |
|---|---|---|---|
| Previous Owner | Combs Phillip | $69,900 |
Source: Public Records
Tax History Compared to Growth
Tax History
| Year | Tax Paid | Tax Assessment Tax Assessment Total Assessment is a certain percentage of the fair market value that is determined by local assessors to be the total taxable value of land and additions on the property. | Land | Improvement |
|---|---|---|---|---|
| 2024 | $498 | $28,300 | $3,825 | $24,475 |
| 2023 | $498 | $28,300 | $0 | $0 |
| 2022 | $468 | $26,600 | $3,825 | $22,775 |
| 2021 | $468 | $26,600 | $3,825 | $22,775 |
| 2020 | $468 | $26,600 | $3,825 | $22,775 |
| 2019 | $800 | $23,500 | $3,825 | $19,675 |
| 2018 | $741 | $23,500 | $3,825 | $19,675 |
| 2017 | $729 | $23,500 | $3,825 | $19,675 |
| 2016 | $696 | $23,500 | $3,825 | $19,675 |
| 2015 | $647 | $23,500 | $3,825 | $19,675 |
| 2014 | -- | $23,500 | $3,825 | $19,675 |
| 2013 | -- | $26,075 | $0 | $0 |
Source: Public Records
Map
Nearby Homes
- 828 Overlook Dr
- 423 Hayter Dr
- 1256 Arden Ln
- 1621 S Cumberland St
- Lot 101 Geneva Ln
- Lot 99 Geneva Ln
- 98 Geneva Ln
- Lot 100 Geneva Ln
- 108 Annie Ln
- 109 Annie Ln
- 2945 Enka Hwy
- 305-365 Barkley Landing Dr
- 000 Bacon Ln
- 1051 Wilson Hale Rd
- 816 Choctaw St
- 1205 Ledford Ave
- 819 Choctaw St
- 0 Joe Hall Rd Unit 703714
- 1200 Liberty Hall Dr
- 808 Gaston St
- 995 Fish Hatchery Rd
- 557 Fish Hatchery Rd
- 526 Fish Hatchery Rd
- 635 Palomino Rd
- 2146 Daniels Dr
- 1915 Rogers Rd
- 1025 Fish Hatchery Rd
- 1901 Rogers Rd
- 2408 Daniels Dr
- 1004 Fish Hatchery Rd
- Lot 5 Daniels Dr
- LOTS Daniels Dr
- 0 Daniels Dr
- 2412 Daniels Dr
- 2414 Daniels Dr
- 2416 Daniels Dr
- 1860 Pinecrest Ln
- 460 Farm Rd
- 1848 Pinecrest Ln
- 1010 Fish Hatchery Rd