629 Joaquin Dr Sonoma, CA 95476
Estimated Value: $1,031,589 - $1,234,000
4
Beds
3
Baths
1,908
Sq Ft
$583/Sq Ft
Est. Value
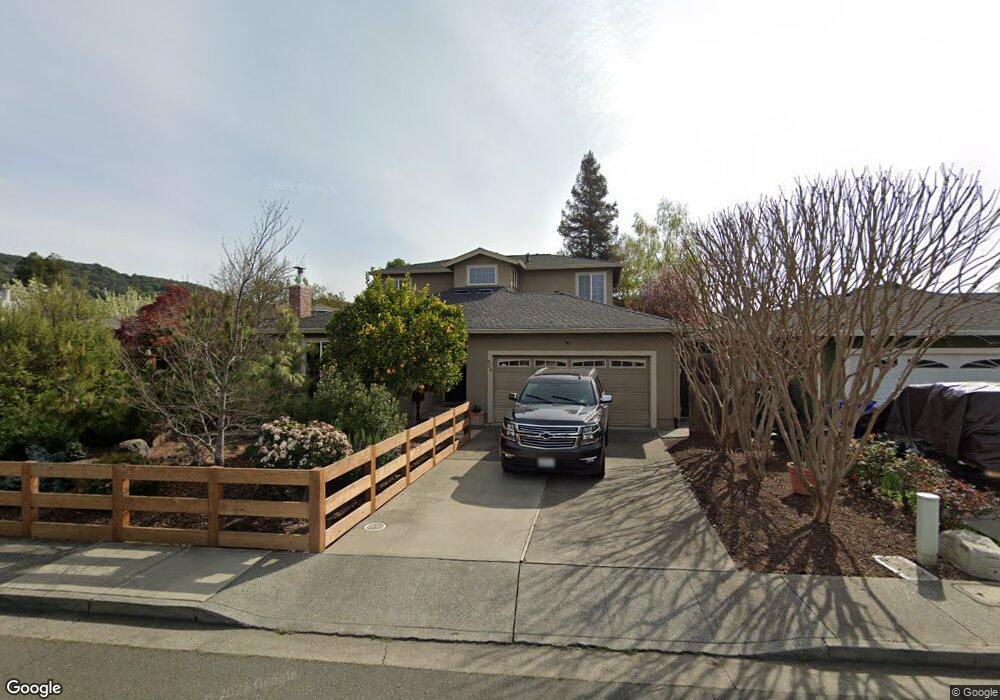
About This Home
This home is located at 629 Joaquin Dr, Sonoma, CA 95476 and is currently estimated at $1,112,397, approximately $583 per square foot. 629 Joaquin Dr is a home located in Sonoma County with nearby schools including Sassarini Elementary School, Altimira Middle School, and Creekside High School.
Ownership History
Date
Name
Owned For
Owner Type
Purchase Details
Closed on
Jul 12, 2011
Sold by
Gilman Matthew Whitney
Bought by
Gilman Matthew W and Matthew W Gilman Revocable Tru
Current Estimated Value
Purchase Details
Closed on
Jul 21, 2009
Sold by
Scott Carole Juliett and Bruckner Helge H
Bought by
Gilman Matthew Whitney
Purchase Details
Closed on
Oct 10, 2008
Sold by
Peterson Jeffrey L and Peterson Katherine M
Bought by
Gilman Matthew Whitney and Scott Carole Juliett
Purchase Details
Closed on
Jun 26, 1996
Sold by
Exchange Bank
Bought by
Peterson Jeffrey L and Peterson Katherine M
Home Financials for this Owner
Home Financials are based on the most recent Mortgage that was taken out on this home.
Original Mortgage
$163,400
Interest Rate
6.25%
Purchase Details
Closed on
Jan 12, 1995
Sold by
Wells Fargo Bank N A
Bought by
Exchange Bank and The Eva Bercut Trust
Purchase Details
Closed on
Feb 24, 1994
Sold by
Bercut Eva
Bought by
Wells Fargo Bank
Create a Home Valuation Report for This Property
The Home Valuation Report is an in-depth analysis detailing your home's value as well as a comparison with similar homes in the area
Home Values in the Area
Average Home Value in this Area
Purchase History
| Date | Buyer | Sale Price | Title Company |
|---|---|---|---|
| Gilman Matthew W | -- | None Available | |
| Gilman Matthew Whitney | -- | None Available | |
| Gilman Matthew Whitney | $590,000 | First American Title Company | |
| Peterson Jeffrey L | $175,500 | Fidelity National Title Co | |
| Exchange Bank | -- | -- | |
| Wells Fargo Bank | -- | -- |
Source: Public Records
Mortgage History
| Date | Status | Borrower | Loan Amount |
|---|---|---|---|
| Previous Owner | Peterson Jeffrey L | $163,400 |
Source: Public Records
Tax History
| Year | Tax Paid | Tax Assessment Tax Assessment Total Assessment is a certain percentage of the fair market value that is determined by local assessors to be the total taxable value of land and additions on the property. | Land | Improvement |
|---|---|---|---|---|
| 2025 | $10,763 | $831,163 | $347,687 | $483,476 |
| 2024 | $10,763 | $814,867 | $340,870 | $473,997 |
| 2023 | $10,763 | $730,263 | $334,187 | $396,076 |
| 2022 | $9,653 | $715,945 | $327,635 | $388,310 |
| 2021 | $9,432 | $701,908 | $321,211 | $380,697 |
| 2020 | $9,312 | $694,712 | $317,918 | $376,794 |
| 2019 | $9,174 | $681,091 | $311,685 | $369,406 |
| 2018 | $9,033 | $667,737 | $305,574 | $362,163 |
| 2017 | $8,789 | $654,645 | $299,583 | $355,062 |
| 2016 | $8,181 | $641,809 | $293,709 | $348,100 |
| 2015 | $8,161 | $632,170 | $289,298 | $342,872 |
| 2014 | $7,868 | $619,788 | $283,632 | $336,156 |
Source: Public Records
Map
Nearby Homes
- 19295 Junipero Serra Dr
- 836 W Spain St Unit 6
- 836 W Spain St Unit 3
- 443 Casabonne Ln
- 441 7th St W Unit 5
- 797 W Spain St
- 472 5th St W
- 15881 Highway 12
- 377 W Spain St
- 110 La Mancha Dr
- 865 W Napa St
- 554 7th St W
- 520 Studley St
- 605 Curtin Ln
- 49 Ramon St
- 301 1st St W
- 19322 Quigley Ln
- 69 Guadalajara Dr
- 109 Merida Dr
- 337 Bettencourt St
Your Personal Tour Guide
Ask me questions while you tour the home.