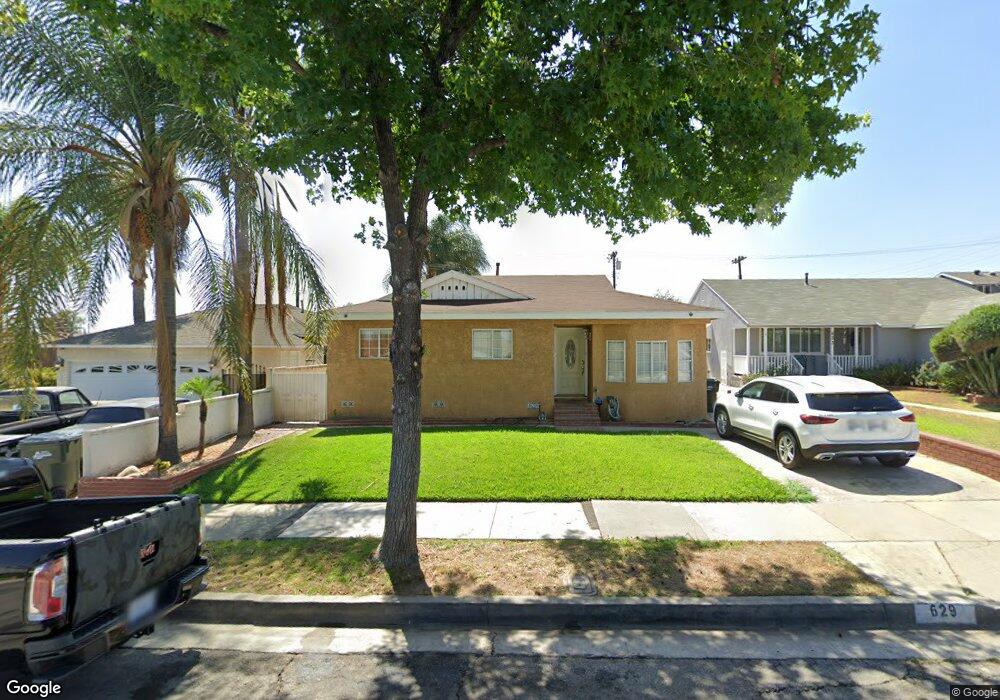
629 N 3rd St Montebello, CA 90640
Estimated Value: $769,000 - $930,000
3
Beds
2
Baths
1,455
Sq Ft
$589/Sq Ft
Est. Value
About This Home
This home is located at 629 N 3rd St, Montebello, CA 90640 and is currently estimated at $857,195, approximately $589 per square foot. 629 N 3rd St is a home located in Los Angeles County with nearby schools including La Merced Elementary School, La Merced Intermediate School, and Montebello High School.
Ownership History
Date
Name
Owned For
Owner Type
Purchase Details
Closed on
Oct 2, 1998
Sold by
Magna Funding Corp
Bought by
Atilano Juan and Atilano Victoria
Current Estimated Value
Home Financials for this Owner
Home Financials are based on the most recent Mortgage that was taken out on this home.
Original Mortgage
$152,000
Outstanding Balance
$32,734
Interest Rate
6.71%
Mortgage Type
Stand Alone First
Estimated Equity
$824,461
Purchase Details
Closed on
Mar 4, 1998
Sold by
Gonzalez Peter J
Bought by
Magna Funding Corp
Purchase Details
Closed on
Nov 16, 1993
Sold by
Gutierrez Rafael Emilio
Bought by
Gonzalez Peter J and Gonzalez Judy
Home Financials for this Owner
Home Financials are based on the most recent Mortgage that was taken out on this home.
Original Mortgage
$200,450
Interest Rate
7.21%
Create a Home Valuation Report for This Property
The Home Valuation Report is an in-depth analysis detailing your home's value as well as a comparison with similar homes in the area
Home Values in the Area
Average Home Value in this Area
Purchase History
| Date | Buyer | Sale Price | Title Company |
|---|---|---|---|
| Atilano Juan | $190,000 | First American Title Co | |
| Magna Funding Corp | $213,455 | First Southwestern Title Co | |
| Gonzalez Peter J | $211,000 | Investors Title Company |
Source: Public Records
Mortgage History
| Date | Status | Borrower | Loan Amount |
|---|---|---|---|
| Open | Atilano Juan | $152,000 | |
| Previous Owner | Gonzalez Peter J | $200,450 |
Source: Public Records
Tax History
| Year | Tax Paid | Tax Assessment Tax Assessment Total Assessment is a certain percentage of the fair market value that is determined by local assessors to be the total taxable value of land and additions on the property. | Land | Improvement |
|---|---|---|---|---|
| 2025 | $4,713 | $297,836 | $176,512 | $121,324 |
| 2024 | $4,713 | $291,997 | $173,051 | $118,946 |
| 2023 | $4,691 | $286,272 | $169,658 | $116,614 |
| 2022 | $4,534 | $280,660 | $166,332 | $114,328 |
| 2021 | $4,368 | $275,158 | $163,071 | $112,087 |
| 2019 | $4,168 | $266,998 | $158,235 | $108,763 |
| 2018 | $4,148 | $261,764 | $155,133 | $106,631 |
| 2016 | $3,968 | $251,602 | $149,110 | $102,492 |
| 2015 | $3,766 | $247,824 | $146,871 | $100,953 |
| 2014 | $3,719 | $242,970 | $143,994 | $98,976 |
Source: Public Records
Map
Nearby Homes
- 217 Dochan Cir
- 801 N 2nd St
- 337 N 3rd St
- 344 N 1st St
- 653 N Raywood Ave
- 211 Peacock Ln
- 424 Bradley Ave
- 312 N Poplar Ave
- 1115 Sheila Ct
- 416 W Cleveland Ave
- 713 N Orcutt Dr
- 132 N 2nd St
- 478 Sycamore Dr W
- 605 E Avenida de la Merced
- 888 Poppy Ct
- 1401 W Beverly Terrace
- 4739 Ivy St
- 4139 Paramount Blvd Unit 18
- 385 Mariposa Way
- 105 Remy Ln
Your Personal Tour Guide
Ask me questions while you tour the home.