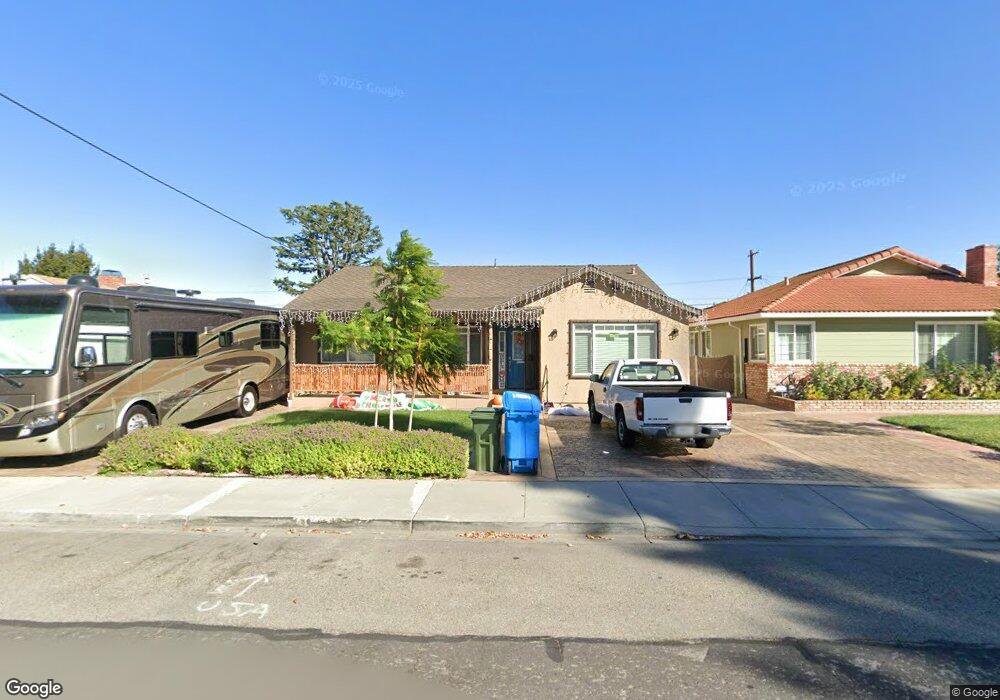
629 Robin Dr Santa Clara, CA 95050
Pruneridge NeighborhoodEstimated Value: $1,911,000 - $2,278,000
3
Beds
2
Baths
854
Sq Ft
$2,440/Sq Ft
Est. Value
About This Home
This home is located at 629 Robin Dr, Santa Clara, CA 95050 and is currently estimated at $2,084,128, approximately $2,440 per square foot. 629 Robin Dr is a home located in Santa Clara County with nearby schools including Westwood Elementary School, Buchser Middle School, and Santa Clara High School.
Ownership History
Date
Name
Owned For
Owner Type
Purchase Details
Closed on
Apr 9, 2001
Sold by
Desousa Bernadette and Desousa Frank L
Bought by
Desousa Frank L and Desousa Annette B
Current Estimated Value
Home Financials for this Owner
Home Financials are based on the most recent Mortgage that was taken out on this home.
Original Mortgage
$260,000
Outstanding Balance
$95,560
Interest Rate
6.98%
Estimated Equity
$1,988,568
Purchase Details
Closed on
Oct 18, 2000
Sold by
Bernadette Desousa and Bernadette Frank L
Bought by
Desouse Frank L and Desouse Bernadette
Purchase Details
Closed on
Aug 26, 1999
Sold by
Bernadette Desousa and Bernadette Frank L
Bought by
Desousa Frank L and Desousa Bernadette
Home Financials for this Owner
Home Financials are based on the most recent Mortgage that was taken out on this home.
Original Mortgage
$200,000
Interest Rate
7.47%
Create a Home Valuation Report for This Property
The Home Valuation Report is an in-depth analysis detailing your home's value as well as a comparison with similar homes in the area
Home Values in the Area
Average Home Value in this Area
Purchase History
| Date | Buyer | Sale Price | Title Company |
|---|---|---|---|
| Desousa Frank L | $130,000 | Financial Title Company | |
| Desouse Frank L | $25,000 | -- | |
| Desousa Frank L | $57,000 | Financial Title Company |
Source: Public Records
Mortgage History
| Date | Status | Borrower | Loan Amount |
|---|---|---|---|
| Open | Desousa Frank L | $260,000 | |
| Closed | Desousa Frank L | $200,000 |
Source: Public Records
Tax History Compared to Growth
Tax History
| Year | Tax Paid | Tax Assessment Tax Assessment Total Assessment is a certain percentage of the fair market value that is determined by local assessors to be the total taxable value of land and additions on the property. | Land | Improvement |
|---|---|---|---|---|
| 2025 | $6,568 | $571,237 | $331,146 | $240,091 |
| 2024 | $6,568 | $560,037 | $324,653 | $235,384 |
| 2023 | $6,500 | $549,057 | $318,288 | $230,769 |
| 2022 | $6,392 | $538,293 | $312,048 | $226,245 |
| 2021 | $6,364 | $527,739 | $305,930 | $221,809 |
| 2020 | $6,248 | $522,329 | $302,794 | $219,535 |
| 2019 | $6,239 | $512,088 | $296,857 | $215,231 |
| 2018 | $5,839 | $502,048 | $291,037 | $211,011 |
| 2017 | $5,809 | $492,205 | $285,331 | $206,874 |
| 2016 | $5,712 | $482,555 | $279,737 | $202,818 |
| 2015 | $5,689 | $475,308 | $275,536 | $199,772 |
| 2014 | $5,400 | $465,998 | $270,139 | $195,859 |
Source: Public Records
Map
Nearby Homes
- 2416 Johnson Place
- 2421 Rebecca Lynn Way
- 821 Kolb Place
- 952 Fairfield Ave
- 2360 De Varona Place
- 476 N Winchester Blvd Unit 103
- 2530 Forbes Ave
- 584 Valeri Ruth Ct
- 2320 Talia Ave
- 2487 Rebecca Lynn Way
- 2461 Boxwood Dr
- 2475 Karen Dr
- 323 Cypress Ave
- 2611 Pepperwood Ln
- 1694 Homestead Rd
- 695 Cupples Ct
- 2373 Newhall St
- 3430 Forest Ave
- 2805 Sykes Ct
- 1465 Isabella St