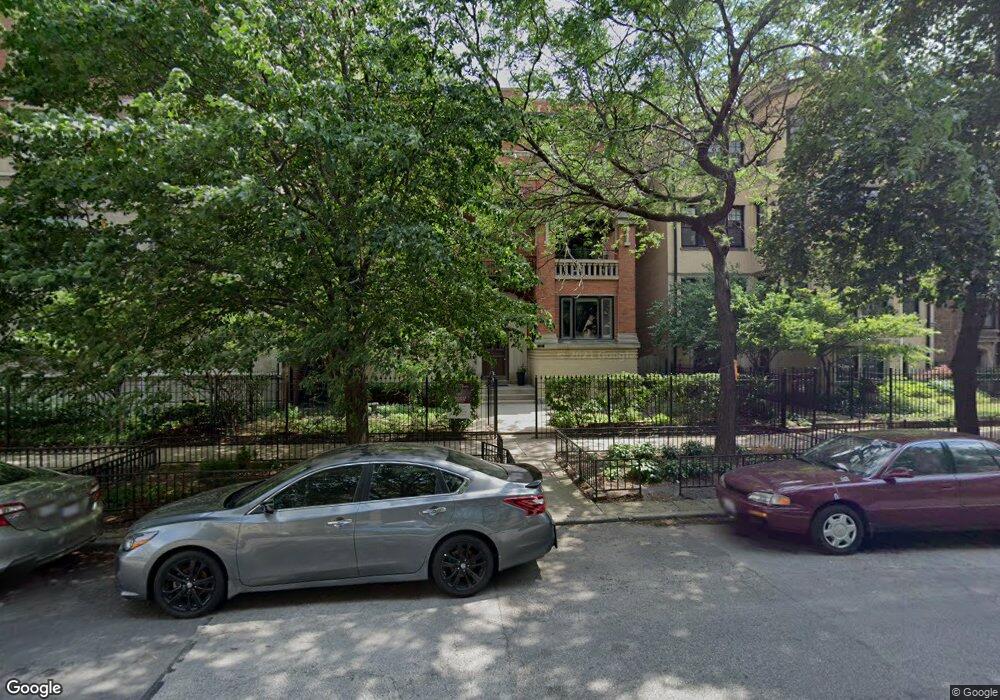
629 W Sheridan Rd Unit 2D Chicago, IL 60613
Lakeview East NeighborhoodEstimated Value: $316,965 - $427,000
--
Bed
--
Bath
18,016
Sq Ft
$19/Sq Ft
Est. Value
About This Home
This home is located at 629 W Sheridan Rd Unit 2D, Chicago, IL 60613 and is currently estimated at $348,741, approximately $19 per square foot. 629 W Sheridan Rd Unit 2D is a home located in Cook County with nearby schools including Greeley Elementary School, Lake View High School, and Bernard Zell Anshe Emet Day School.
Create a Home Valuation Report for This Property
The Home Valuation Report is an in-depth analysis detailing your home's value as well as a comparison with similar homes in the area
Home Values in the Area
Average Home Value in this Area
Tax History Compared to Growth
Tax History
| Year | Tax Paid | Tax Assessment Tax Assessment Total Assessment is a certain percentage of the fair market value that is determined by local assessors to be the total taxable value of land and additions on the property. | Land | Improvement |
|---|---|---|---|---|
| 2024 | $4,575 | $27,072 | $4,946 | $22,126 |
| 2023 | $4,438 | $25,000 | $4,421 | $20,579 |
| 2022 | $4,438 | $25,000 | $4,421 | $20,579 |
| 2021 | $4,357 | $24,999 | $4,421 | $20,578 |
| 2020 | $4,903 | $25,114 | $2,763 | $22,351 |
| 2019 | $4,372 | $25,188 | $2,763 | $22,425 |
| 2018 | $4,297 | $25,188 | $2,763 | $22,425 |
| 2017 | $4,353 | $23,595 | $2,431 | $21,164 |
| 2016 | $4,226 | $23,595 | $2,431 | $21,164 |
| 2015 | $3,843 | $23,595 | $2,431 | $21,164 |
| 2014 | $3,274 | $20,216 | $1,879 | $18,337 |
| 2013 | $3,199 | $20,216 | $1,879 | $18,337 |
Source: Public Records
Map
Nearby Homes
- 3900 N Lake Shore Dr Unit 15C
- 3900 N Lake Shore Dr Unit 17G
- 3900 N Lake Shore Dr Unit 19A
- 3900 N Lake Shore Dr Unit 14D
- 3920 N Lake Shore Dr Unit 4N
- 3920 N Lake Shore Dr Unit 3S
- 3920 N Lake Shore Dr Unit 12N
- 3950 N Lake Shore Dr Unit 1207
- 3950 N Lake Shore Dr Unit 1706
- 3950 N Lake Shore Dr Unit 1303
- 3950 N Lake Shore Dr Unit 904
- 3950 N Lake Shore Dr Unit 2125
- 3950 N Lake Shore Dr Unit 1202
- 3950 N Lake Shore Dr Unit 523
- 3800 N Lake Shore Dr Unit 11E
- 3800 N Lake Shore Dr Unit 5B
- 3800 N Lake Shore Dr Unit 2C
- 651 W Sheridan Rd Unit 4D
- 655 W Irving Park Rd Unit 5502
- 655 W Irving Park Rd Unit 5104
- 629 W Sheridan Rd Unit 1A
- 629 W Sheridan Rd Unit 3C
- 629 W Sheridan Rd Unit 2C
- 629 W Sheridan Rd Unit 3B
- 629 W Sheridan Rd Unit 3A
- 629 W Sheridan Rd Unit 3D
- 629 W Sheridan Rd Unit 1D
- 629 W Sheridan Rd Unit 1C
- 629 W Sheridan Rd Unit 2B
- 629 W Sheridan Rd Unit 1B
- 629 W Sheridan Rd Unit 2A
- 631 W Sheridan Rd Unit 2B
- 631 W Sheridan Rd Unit 1W
- 635 W Sheridan Rd Unit G
- 635 W Sheridan Rd Unit 1
- 635 W Sheridan Rd Unit 2
- 3800 N Lake Shore Dr Unit 4G
- 3800 N Lake Shore Dr Unit 1J
- 3800 N Lake Shore Dr Unit 9C
- 3800 N Lake Shore Dr Unit 4C