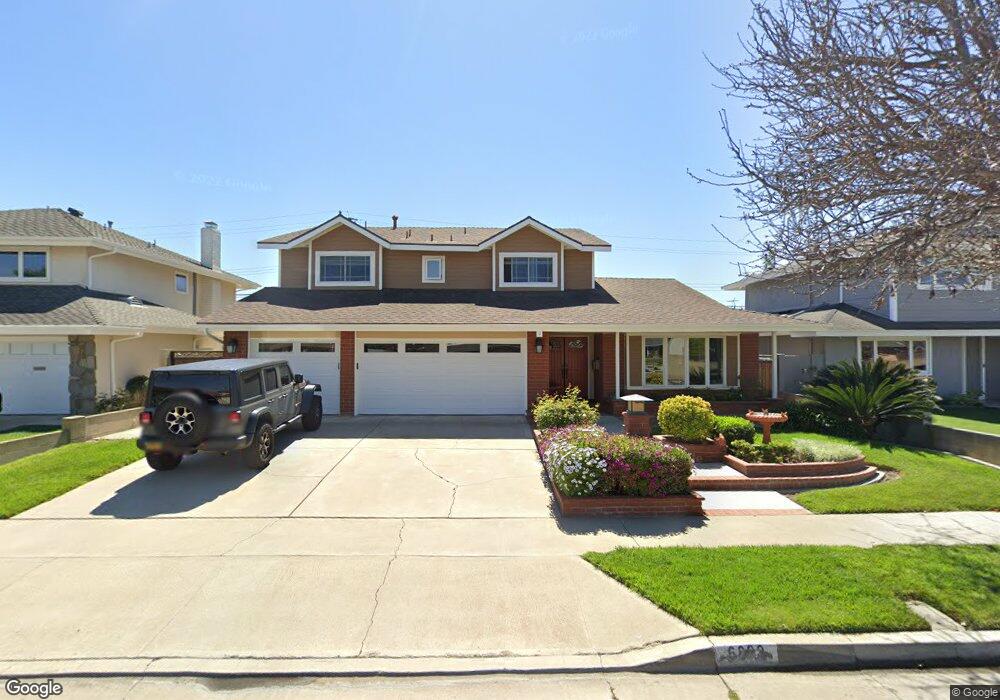
6292 Flint Dr Huntington Beach, CA 92647
Estimated Value: $1,533,701 - $1,678,000
4
Beds
3
Baths
2,500
Sq Ft
$646/Sq Ft
Est. Value
About This Home
This home is located at 6292 Flint Dr, Huntington Beach, CA 92647 and is currently estimated at $1,614,675, approximately $645 per square foot. 6292 Flint Dr is a home located in Orange County with nearby schools including Circle View Elementary School, Spring View Middle School, and Marina High School.
Ownership History
Date
Name
Owned For
Owner Type
Purchase Details
Closed on
May 23, 2017
Sold by
Sterbens Raymond W and Sterbens Martha C
Bought by
Sterbens Raymond W and Sterbens Martha C
Current Estimated Value
Purchase Details
Closed on
Mar 26, 1998
Sold by
Alex Antoski
Bought by
Sterbens Raymond W and Sterbens Martha C
Home Financials for this Owner
Home Financials are based on the most recent Mortgage that was taken out on this home.
Original Mortgage
$194,000
Outstanding Balance
$36,666
Interest Rate
7.05%
Estimated Equity
$1,578,009
Purchase Details
Closed on
Feb 20, 1998
Sold by
Antoski Tonya
Bought by
Antoski Alex
Home Financials for this Owner
Home Financials are based on the most recent Mortgage that was taken out on this home.
Original Mortgage
$194,000
Outstanding Balance
$36,666
Interest Rate
7.05%
Estimated Equity
$1,578,009
Create a Home Valuation Report for This Property
The Home Valuation Report is an in-depth analysis detailing your home's value as well as a comparison with similar homes in the area
Home Values in the Area
Average Home Value in this Area
Purchase History
| Date | Buyer | Sale Price | Title Company |
|---|---|---|---|
| Sterbens Raymond W | -- | None Available | |
| Sterbens Raymond W | $339,000 | Old Republic Title Company | |
| Antoski Alex | -- | Old Republic Title Company |
Source: Public Records
Mortgage History
| Date | Status | Borrower | Loan Amount |
|---|---|---|---|
| Open | Sterbens Raymond W | $194,000 |
Source: Public Records
Tax History Compared to Growth
Tax History
| Year | Tax Paid | Tax Assessment Tax Assessment Total Assessment is a certain percentage of the fair market value that is determined by local assessors to be the total taxable value of land and additions on the property. | Land | Improvement |
|---|---|---|---|---|
| 2025 | $6,127 | $541,291 | $343,021 | $198,270 |
| 2024 | $6,127 | $530,678 | $336,295 | $194,383 |
| 2023 | $5,986 | $520,273 | $329,701 | $190,572 |
| 2022 | $5,896 | $510,072 | $323,236 | $186,836 |
| 2021 | $5,788 | $500,071 | $316,898 | $183,173 |
| 2020 | $5,723 | $494,944 | $313,649 | $181,295 |
| 2019 | $5,623 | $485,240 | $307,499 | $177,741 |
| 2018 | $5,496 | $475,726 | $301,470 | $174,256 |
| 2017 | $5,408 | $466,399 | $295,559 | $170,840 |
| 2016 | $5,186 | $457,254 | $289,763 | $167,491 |
| 2015 | $5,107 | $450,386 | $285,410 | $164,976 |
| 2014 | $5,005 | $441,564 | $279,819 | $161,745 |
Source: Public Records
Map
Nearby Homes
- 16401 Mercier Ln
- 16261 Angler Ln
- 6522 Limerick Dr
- 15801 Carrie Ln
- 6292 Heil Ave
- 6631 Walton Dr
- 6351 Gloria Dr
- 5751 Mangrum Dr
- 16652 Busby Ln
- 16542 Los Verdes Ln
- 6781 Retherford Dr
- 7223 Alchemy Cir
- 7252 Ellington Dr
- 7231 Alchemy Cir
- 7248 Aura Cir
- 7264 Aura Cir
- 7272 Ellington Dr
- 15722 Dawson Ln
- 5591 Heil Ave
- 7002 Valentine Dr
- 6302 Flint Dr
- 6282 Flint Dr
- 6291 Reubens Dr
- 6281 Reubens Dr
- 6311 Reubens Dr
- 6322 Flint Dr
- 6262 Flint Dr
- 16091 Jereva Cir
- 6271 Reubens Dr
- 6321 Reubens Dr
- 6332 Flint Dr
- 16092 Ballantine Ln
- 16092 Jereva Cir
- 6331 Reubens Dr
- 16081 Jereva Cir
- 16082 Ballantine Ln
- 6342 Flint Dr
- 6282 Reubens Dr
- 6292 Reubens Dr
- 6341 Reubens Dr