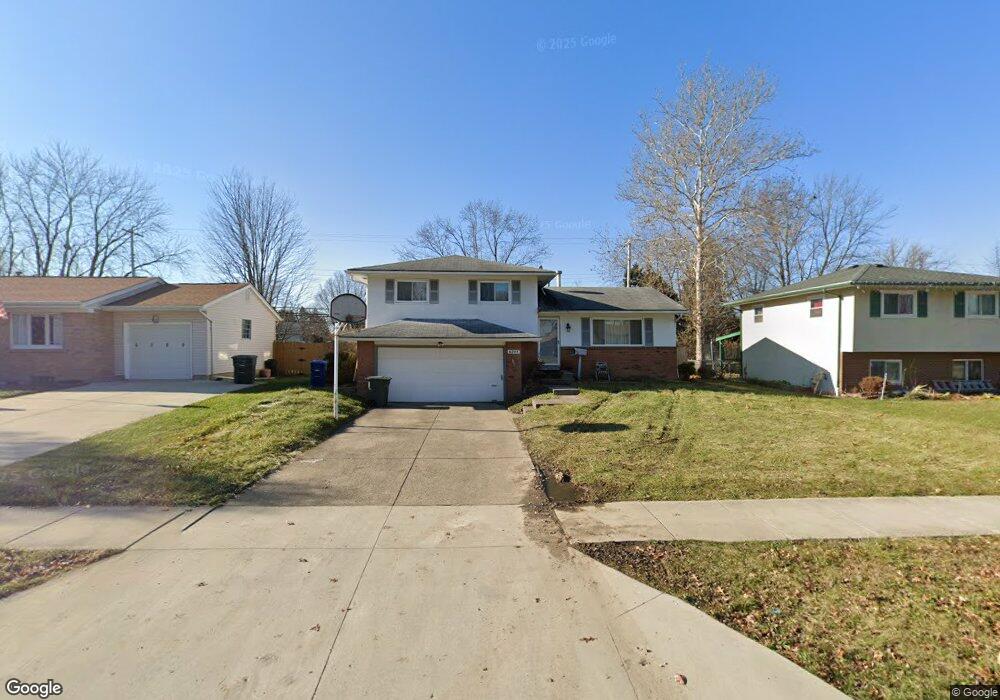
6295 Karl Rd Columbus, OH 43229
Devonshire NeighborhoodEstimated Value: $253,000 - $267,000
3
Beds
2
Baths
1,584
Sq Ft
$166/Sq Ft
Est. Value
About This Home
This home is located at 6295 Karl Rd, Columbus, OH 43229 and is currently estimated at $262,918, approximately $165 per square foot. 6295 Karl Rd is a home located in Franklin County with nearby schools including Devonshire Alternative Elementary School, Woodward Park Middle School, and Beechcroft High School.
Ownership History
Date
Name
Owned For
Owner Type
Purchase Details
Closed on
May 23, 2025
Sold by
Dreamhouse Llc
Bought by
Kurzenev Anna Milson
Current Estimated Value
Purchase Details
Closed on
Aug 1, 2014
Sold by
Wimer Mark R
Bought by
Thompson Alice and Thompson George
Purchase Details
Closed on
Dec 21, 2010
Sold by
Wimer Brandi R
Bought by
Wimer Mark R
Purchase Details
Closed on
Dec 9, 2004
Sold by
Carter Richard E and Carter Patsy
Bought by
Wimer Mark R and Wimer Brandi R
Home Financials for this Owner
Home Financials are based on the most recent Mortgage that was taken out on this home.
Original Mortgage
$123,068
Interest Rate
5.77%
Mortgage Type
FHA
Purchase Details
Closed on
May 28, 1998
Sold by
Brainard John J and Brainard Rosalie
Bought by
Carter Richard E
Purchase Details
Closed on
Jun 25, 1993
Purchase Details
Closed on
Dec 13, 1989
Create a Home Valuation Report for This Property
The Home Valuation Report is an in-depth analysis detailing your home's value as well as a comparison with similar homes in the area
Home Values in the Area
Average Home Value in this Area
Purchase History
| Date | Buyer | Sale Price | Title Company |
|---|---|---|---|
| Kurzenev Anna Milson | $255,000 | Ohio Real Title | |
| Thompson Alice | $110,000 | Stewart Title | |
| Wimer Mark R | -- | Attorney | |
| Wimer Mark R | $125,000 | -- | |
| Carter Richard E | $91,000 | Chicago Title | |
| -- | $77,000 | -- | |
| -- | $72,500 | -- |
Source: Public Records
Mortgage History
| Date | Status | Borrower | Loan Amount |
|---|---|---|---|
| Previous Owner | Wimer Mark R | $123,068 |
Source: Public Records
Tax History Compared to Growth
Tax History
| Year | Tax Paid | Tax Assessment Tax Assessment Total Assessment is a certain percentage of the fair market value that is determined by local assessors to be the total taxable value of land and additions on the property. | Land | Improvement |
|---|---|---|---|---|
| 2024 | $7,538 | $78,270 | $17,120 | $61,150 |
| 2023 | $9,864 | $78,260 | $17,115 | $61,145 |
| 2022 | $9,823 | $56,420 | $13,370 | $43,050 |
| 2021 | $6,102 | $56,420 | $13,370 | $43,050 |
| 2020 | $3,748 | $56,420 | $13,370 | $43,050 |
| 2019 | $3,880 | $45,540 | $10,710 | $34,830 |
| 2018 | $2,323 | $45,540 | $10,710 | $34,830 |
| 2017 | $3,114 | $45,540 | $10,710 | $34,830 |
| 2016 | $2,082 | $31,430 | $8,120 | $23,310 |
| 2015 | $1,890 | $31,430 | $8,120 | $23,310 |
| 2014 | $1,949 | $31,430 | $8,120 | $23,310 |
| 2013 | $1,068 | $34,930 | $9,030 | $25,900 |
Source: Public Records
Map
Nearby Homes
- 1549 Alpine Dr
- 6407 Faircrest Rd
- 6342 Bellmeadow Dr
- 6458 Faircrest Rd
- 6035 Karl Rd
- 1268 Kildale Ct
- 1288 Oakfield Dr N
- 1421 Bosworth Place
- 1409 Bosworth Place
- 6407 Skywae Dr
- 1635 Tendril Ct
- 6189 Northgap Dr
- 5990 Ambleside Dr
- 6245 Sharon Woods Blvd
- 6211 Parkdale Dr
- 1294 Clydesdale Ct
- 6355 Johnanne St
- 1390 E Dublin Granville Rd
- 1322 Bolenhill Ct
- 1171 Newbury Dr
- 6285 Karl Rd
- 6303 Karl Rd
- 6311 Karl Rd
- 6277 Karl Rd
- 6288 Chelmsford Square E
- 1474 Chelmsford Square N
- 6332 Archmere Square E
- 6292 Karl Rd
- 1479 Archmere Square S
- 6300 Karl Rd
- 6321 Karl Rd
- 6269 Karl Rd
- 6282 Karl Rd
- 6336 Archmere Square E
- 6310 Karl Rd
- 1468 Chelmsford Square N
- 6274 Karl Rd
- 1473 Archmere Square S
- 6329 Karl Rd
- 6318 Karl Rd