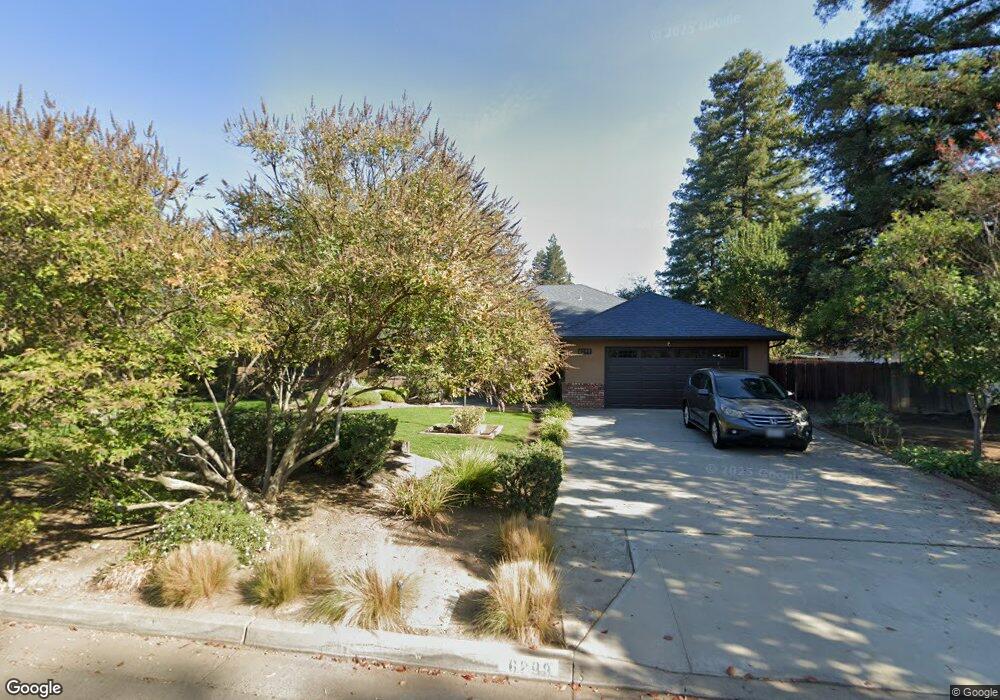
6298 N Benedict Ave Fresno, CA 93711
Fig Garden Loop NeighborhoodEstimated Value: $540,040 - $575,000
3
Beds
2
Baths
2,409
Sq Ft
$234/Sq Ft
Est. Value
About This Home
This home is located at 6298 N Benedict Ave, Fresno, CA 93711 and is currently estimated at $563,260, approximately $233 per square foot. 6298 N Benedict Ave is a home located in Fresno County with nearby schools including Figarden Elementary School, Tenaya Middle School, and Bullard High School.
Ownership History
Date
Name
Owned For
Owner Type
Purchase Details
Closed on
Jul 21, 2009
Sold by
Moreno Maria R
Bought by
Rios Carlos A
Current Estimated Value
Home Financials for this Owner
Home Financials are based on the most recent Mortgage that was taken out on this home.
Original Mortgage
$250,381
Outstanding Balance
$165,724
Interest Rate
5.59%
Mortgage Type
FHA
Estimated Equity
$397,536
Purchase Details
Closed on
Jul 20, 2009
Sold by
Schmidt Rosalie
Bought by
Rios Carlos A
Home Financials for this Owner
Home Financials are based on the most recent Mortgage that was taken out on this home.
Original Mortgage
$250,381
Outstanding Balance
$165,724
Interest Rate
5.59%
Mortgage Type
FHA
Estimated Equity
$397,536
Purchase Details
Closed on
Jul 17, 2009
Sold by
Schmidt Rosalie
Bought by
Schmidt Rosalie and The Rosalie Schmidt Living Trust
Home Financials for this Owner
Home Financials are based on the most recent Mortgage that was taken out on this home.
Original Mortgage
$250,381
Outstanding Balance
$165,724
Interest Rate
5.59%
Mortgage Type
FHA
Estimated Equity
$397,536
Create a Home Valuation Report for This Property
The Home Valuation Report is an in-depth analysis detailing your home's value as well as a comparison with similar homes in the area
Home Values in the Area
Average Home Value in this Area
Purchase History
| Date | Buyer | Sale Price | Title Company |
|---|---|---|---|
| Rios Carlos A | -- | Fidelity National Title Co | |
| Rios Carlos A | $255,000 | Fidelity National Title Co | |
| Schmidt Rosalie | -- | None Available |
Source: Public Records
Mortgage History
| Date | Status | Borrower | Loan Amount |
|---|---|---|---|
| Open | Rios Carlos A | $250,381 |
Source: Public Records
Tax History Compared to Growth
Tax History
| Year | Tax Paid | Tax Assessment Tax Assessment Total Assessment is a certain percentage of the fair market value that is determined by local assessors to be the total taxable value of land and additions on the property. | Land | Improvement |
|---|---|---|---|---|
| 2025 | $4,277 | $329,146 | $77,442 | $251,704 |
| 2023 | $4,035 | $316,367 | $74,436 | $241,931 |
| 2022 | $3,980 | $310,165 | $72,977 | $237,188 |
| 2021 | $3,871 | $304,085 | $71,547 | $232,538 |
| 2020 | $3,854 | $300,968 | $70,814 | $230,154 |
| 2019 | $3,706 | $295,068 | $69,426 | $225,642 |
| 2018 | $3,625 | $289,283 | $68,065 | $221,218 |
| 2017 | $3,563 | $283,612 | $66,731 | $216,881 |
| 2016 | $3,445 | $278,052 | $65,423 | $212,629 |
| 2015 | $3,392 | $273,877 | $64,441 | $209,436 |
| 2014 | $3,327 | $268,513 | $63,179 | $205,334 |
Source: Public Records
Map
Nearby Homes
- 6315 N Marks Ave
- 6107 N Tamera Ave
- 2707 W Menlo Ave
- 6155 N Haslam Ave
- 3386 W Stuart Ave
- 3436 W Sierra Ave
- 2641 W Paul Ave
- 6597 N Haslam Ave
- 3045 W Celeste Ave
- 6691 N Feland Ave
- 3362 W Celeste Ave
- 5755 N Pleasant Ave
- 2964 W Canterbury Ct
- 3135 W Roberts Ave
- 5686 N Briarwood Ave
- 3077 W Pembrook Loop
- 3236 W Browning Ave
- 6035 N Selland Ave
- 6305 N Marty Ave
- 3075 W Silverhill Ln
- 6316 N Benedict Ave
- 6286 N Benedict Ave
- 6301 N Lead Ave
- 6313 N Lead Ave
- 6287 N Lead Ave
- 6299 N Benedict Ave
- 6272 N Benedict Ave
- 6315 N Benedict Ave
- 6285 N Benedict Ave
- 6325 N Lead Ave
- 6271 N Lead Ave
- 6329 N Benedict Ave
- 6273 N Benedict Ave
- 6346 N Benedict Ave
- 6256 N Benedict Ave
- 6341 N Lead Ave
- 6255 N Lead Ave
- 6306 N Feland Ave
- 6292 N Feland Ave
- 6292 N Lead Ave