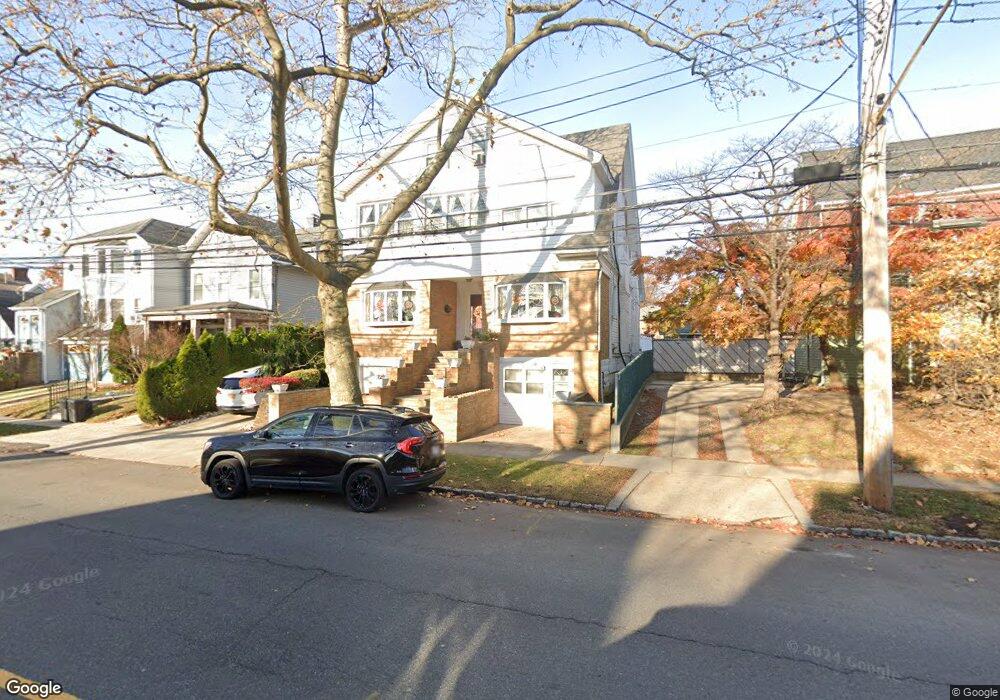
63 10th St Staten Island, NY 10306
New Dorp NeighborhoodEstimated Value: $1,015,842 - $1,377,000
7
Beds
3
Baths
3,000
Sq Ft
$413/Sq Ft
Est. Value
About This Home
This home is located at 63 10th St, Staten Island, NY 10306 and is currently estimated at $1,237,711, approximately $412 per square foot. 63 10th St is a home located in Richmond County with nearby schools including P.S. 41 The Stephanie a Vierno School, Is 2 George L Egbert, and New Dorp High School.
Ownership History
Date
Name
Owned For
Owner Type
Purchase Details
Closed on
Nov 9, 2009
Sold by
Birch Concetta
Bought by
Concetta Birch Irrevocable Trust
Current Estimated Value
Purchase Details
Closed on
Aug 31, 2001
Sold by
Salute Angel and Shea Angel
Bought by
Franolic Robert and Franolic Frances
Home Financials for this Owner
Home Financials are based on the most recent Mortgage that was taken out on this home.
Original Mortgage
$197,000
Interest Rate
6.93%
Create a Home Valuation Report for This Property
The Home Valuation Report is an in-depth analysis detailing your home's value as well as a comparison with similar homes in the area
Home Values in the Area
Average Home Value in this Area
Purchase History
| Date | Buyer | Sale Price | Title Company |
|---|---|---|---|
| Concetta Birch Irrevocable Trust | -- | None Available | |
| Franolic Robert | $454,000 | -- |
Source: Public Records
Mortgage History
| Date | Status | Borrower | Loan Amount |
|---|---|---|---|
| Previous Owner | Franolic Robert | $197,000 |
Source: Public Records
Tax History Compared to Growth
Tax History
| Year | Tax Paid | Tax Assessment Tax Assessment Total Assessment is a certain percentage of the fair market value that is determined by local assessors to be the total taxable value of land and additions on the property. | Land | Improvement |
|---|---|---|---|---|
| 2025 | $8,874 | $60,840 | $10,565 | $50,275 |
| 2024 | $8,886 | $64,920 | $9,395 | $55,525 |
| 2023 | $8,850 | $44,978 | $8,069 | $36,909 |
| 2022 | $8,184 | $62,100 | $13,380 | $48,720 |
| 2021 | $8,122 | $53,160 | $13,380 | $39,780 |
| 2020 | $8,178 | $58,740 | $13,380 | $45,360 |
| 2019 | $7,654 | $57,060 | $13,380 | $43,680 |
| 2018 | $7,343 | $37,482 | $12,365 | $25,117 |
| 2017 | $6,909 | $35,361 | $12,302 | $23,059 |
| 2016 | $6,359 | $33,360 | $13,380 | $19,980 |
| 2015 | $5,770 | $33,554 | $9,543 | $24,011 |
| 2014 | $5,770 | $31,656 | $9,129 | $22,527 |
Source: Public Records
Map
Nearby Homes
- 103 E 10th St Unit 3C
- 109 10th St
- 20 8 St
- 32 Sterling Ave
- 109 8th St
- 75 Jacques Ave
- 129 New Dorp Plaza N
- 91 Allison Ave
- 35 4 St
- 25 4th St
- 78 Cloister Place
- 373 Rose Ave
- 164 Burbank Ave
- 79 Cloister Place
- 155 Burbank Ave
- 77 Burbank Ave
- 80 1st St
- 257 Locust Ave
- 52A Francine Ct Unit 80A
- 52 Francine Ct Unit A