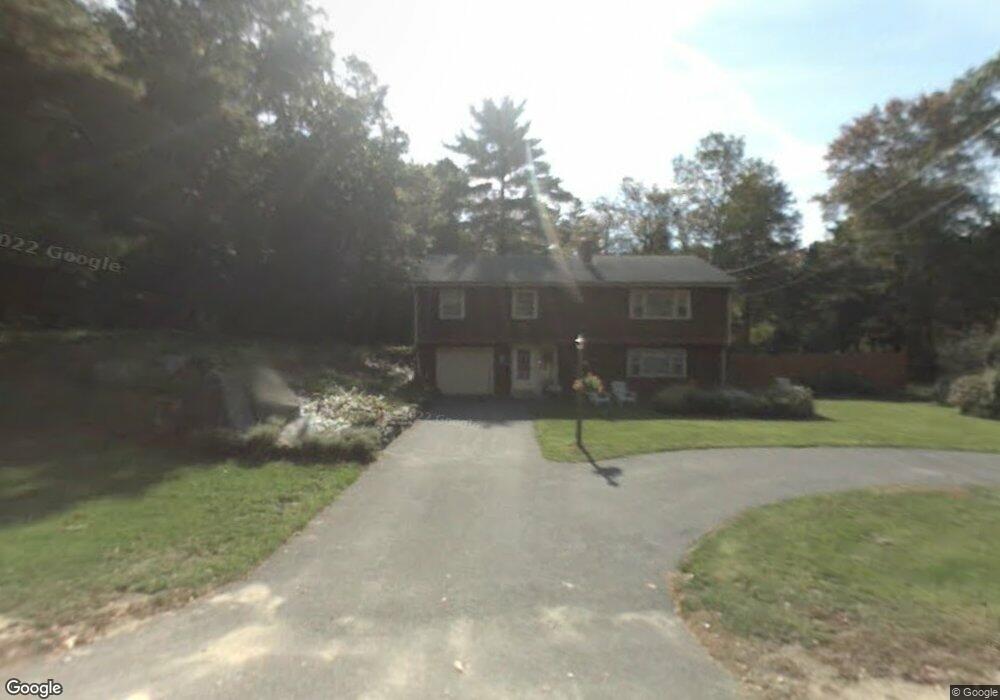
63 Adams Cir Hanson, MA 02341
Estimated Value: $598,854 - $717,000
3
Beds
2
Baths
1,288
Sq Ft
$494/Sq Ft
Est. Value
About This Home
This home is located at 63 Adams Cir, Hanson, MA 02341 and is currently estimated at $635,714, approximately $493 per square foot. 63 Adams Cir is a home located in Plymouth County with nearby schools including Cadence Academy Preschool - Hanover and Cardinal Cushing Centers.
Ownership History
Date
Name
Owned For
Owner Type
Purchase Details
Closed on
Jun 9, 1988
Sold by
Cameron Stephen J
Bought by
Swanson Robert J
Current Estimated Value
Create a Home Valuation Report for This Property
The Home Valuation Report is an in-depth analysis detailing your home's value as well as a comparison with similar homes in the area
Home Values in the Area
Average Home Value in this Area
Purchase History
| Date | Buyer | Sale Price | Title Company |
|---|---|---|---|
| Swanson Robert J | $182,000 | -- |
Source: Public Records
Mortgage History
| Date | Status | Borrower | Loan Amount |
|---|---|---|---|
| Open | Swanson Robert J | $100,000 | |
| Closed | Swanson Robert J | $155,000 | |
| Closed | Swanson Robert J | $19,000 |
Source: Public Records
Tax History
| Year | Tax Paid | Tax Assessment Tax Assessment Total Assessment is a certain percentage of the fair market value that is determined by local assessors to be the total taxable value of land and additions on the property. | Land | Improvement |
|---|---|---|---|---|
| 2025 | $6,869 | $513,400 | $190,600 | $322,800 |
| 2024 | $6,671 | $498,600 | $185,100 | $313,500 |
| 2023 | $6,229 | $439,300 | $185,100 | $254,200 |
| 2022 | $6,027 | $399,400 | $168,200 | $231,200 |
| 2021 | $5,480 | $362,900 | $161,800 | $201,100 |
| 2020 | $5,396 | $353,400 | $156,300 | $197,100 |
| 2019 | $5,167 | $332,700 | $153,300 | $179,400 |
| 2018 | $5,067 | $320,100 | $147,400 | $172,700 |
| 2017 | $4,909 | $307,200 | $140,400 | $166,800 |
| 2016 | $4,967 | $300,100 | $140,400 | $159,700 |
| 2015 | $4,716 | $296,200 | $140,400 | $155,800 |
Source: Public Records
Map
Nearby Homes
- 339 State St
- 114 Graham Hill Dr
- 430 Brook Bend Rd
- 108 Waterford Dr
- 51 Cervelli Farm Dr
- 37 Dr
- 23 Cervelli Farm Dr
- 38 Cervelli Farm Dr
- 9 Cervelli Farm Dr
- 250 Center St
- 51 Farmside Dr
- 95 Tecumseh Dr
- 35 Sproul Rd
- 36 Grove St
- 139 Fairwood Dr
- 7 Farmside Dr
- 285 W Elm St
- 60 Summer Path Way
- 75 School St
- 26 Stonebridge Dr
Your Personal Tour Guide
Ask me questions while you tour the home.