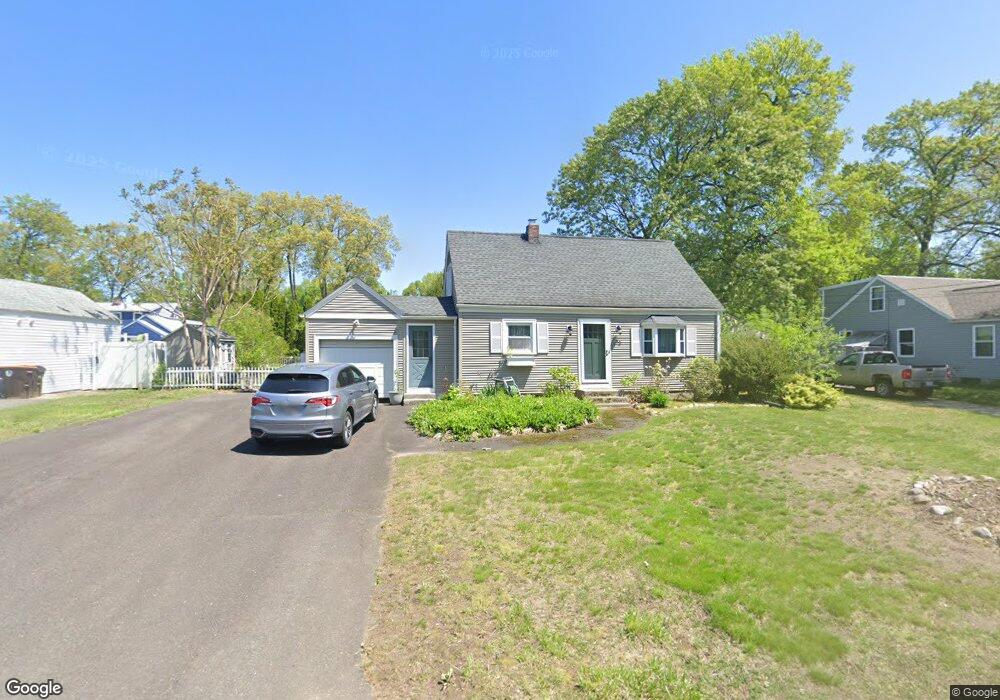
63 Anthony St Agawam, MA 01001
Estimated Value: $301,000 - $370,000
3
Beds
1
Bath
1,152
Sq Ft
$285/Sq Ft
Est. Value
About This Home
This home is located at 63 Anthony St, Agawam, MA 01001 and is currently estimated at $327,914, approximately $284 per square foot. 63 Anthony St is a home located in Hampden County with nearby schools including Agawam Junior High School, Agawam High School, and St Thomas The Apostle School.
Ownership History
Date
Name
Owned For
Owner Type
Purchase Details
Closed on
Aug 27, 2004
Sold by
Lingenberg Jennifer R and Lingenberg Thomas W
Bought by
Teece Sandra L
Current Estimated Value
Home Financials for this Owner
Home Financials are based on the most recent Mortgage that was taken out on this home.
Original Mortgage
$171,000
Outstanding Balance
$85,508
Interest Rate
6.02%
Mortgage Type
Purchase Money Mortgage
Estimated Equity
$242,406
Purchase Details
Closed on
Jun 26, 1997
Sold by
Molloy Edward P
Bought by
Lingenberg Thomas W and Lingenberg Jennifer R
Home Financials for this Owner
Home Financials are based on the most recent Mortgage that was taken out on this home.
Original Mortgage
$99,250
Interest Rate
7.81%
Mortgage Type
Purchase Money Mortgage
Create a Home Valuation Report for This Property
The Home Valuation Report is an in-depth analysis detailing your home's value as well as a comparison with similar homes in the area
Home Values in the Area
Average Home Value in this Area
Purchase History
| Date | Buyer | Sale Price | Title Company |
|---|---|---|---|
| Teece Sandra L | $180,000 | -- | |
| Lingenberg Thomas W | $104,500 | -- |
Source: Public Records
Mortgage History
| Date | Status | Borrower | Loan Amount |
|---|---|---|---|
| Open | Teece Sandra L | $171,000 | |
| Previous Owner | Lingenberg Thomas W | $99,250 |
Source: Public Records
Tax History Compared to Growth
Tax History
| Year | Tax Paid | Tax Assessment Tax Assessment Total Assessment is a certain percentage of the fair market value that is determined by local assessors to be the total taxable value of land and additions on the property. | Land | Improvement |
|---|---|---|---|---|
| 2025 | $3,815 | $260,600 | $99,100 | $161,500 |
| 2024 | $3,667 | $252,200 | $99,100 | $153,100 |
| 2023 | $3,541 | $224,400 | $85,800 | $138,600 |
| 2022 | $3,406 | $211,400 | $85,800 | $125,600 |
| 2021 | $3,271 | $194,700 | $77,600 | $117,100 |
| 2020 | $3,184 | $189,200 | $76,500 | $112,700 |
| 2019 | $3,095 | $185,900 | $75,000 | $110,900 |
| 2018 | $2,945 | $177,300 | $75,000 | $102,300 |
| 2017 | $2,813 | $172,500 | $75,000 | $97,500 |
| 2016 | $2,728 | $168,600 | $75,000 | $93,600 |
| 2015 | $2,594 | $164,800 | $75,000 | $89,800 |
Source: Public Records
Map
Nearby Homes
- 0 Silver St
- 190 Mill St
- 354 Rowley St
- 35 Birch Hill Rd
- 4H Mapleviewlane Unit 4H
- 73 Silver Lake Dr
- 83 Harvey Johnson Dr
- 7 Castle Hill Rd Unit G
- 267 Rowley St
- 795 Main St
- 712 Cooper St
- 6 Castle Hill Rd Unit E
- 198 Beekman Dr
- 13 Castle Hills Rd Unit B
- 172 Beekman Dr Unit 172
- 174 Beekman Dr Unit 174
- 15 B Castle Hills Rd Unit B
- 138 Suffield St
- 51 Reed St
- 37 Corey Colonial