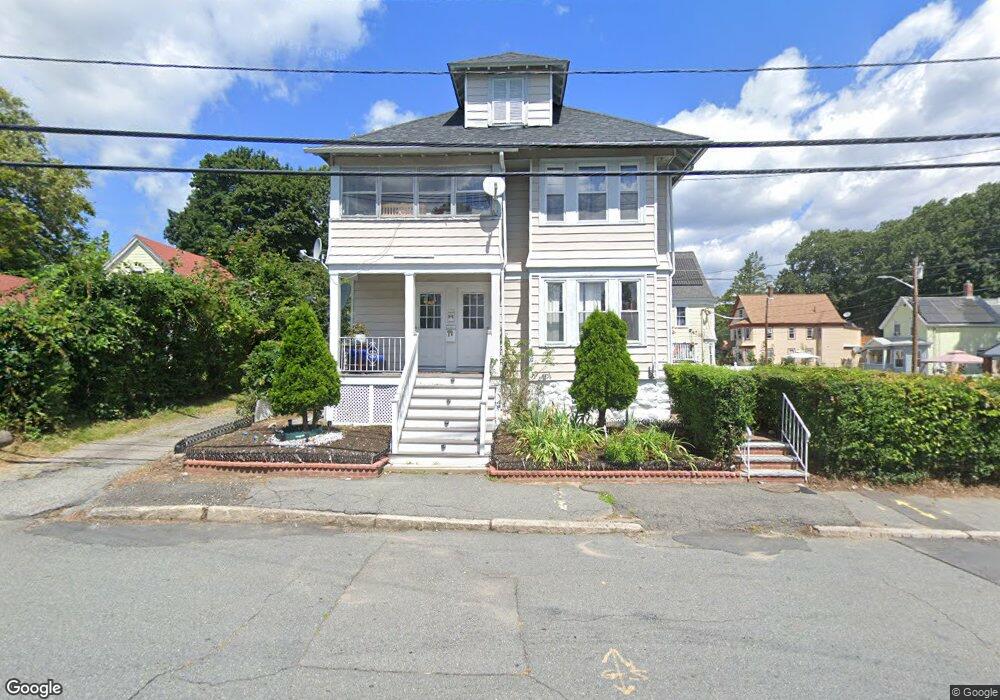
63 Arnold St Unit 65 Methuen, MA 01844
Downtown Methuen NeighborhoodEstimated Value: $704,508 - $861,000
5
Beds
2
Baths
2,578
Sq Ft
$304/Sq Ft
Est. Value
About This Home
This home is located at 63 Arnold St Unit 65, Methuen, MA 01844 and is currently estimated at $783,877, approximately $304 per square foot. 63 Arnold St Unit 65 is a home located in Essex County with nearby schools including Marsh Grammar School, Methuen High School, and Lawrence Family Development Charter School.
Ownership History
Date
Name
Owned For
Owner Type
Purchase Details
Closed on
Oct 7, 2025
Sold by
St Georges Nancy
Bought by
Almonte-Rosario Juan C and Dealmonte Alba R
Current Estimated Value
Home Financials for this Owner
Home Financials are based on the most recent Mortgage that was taken out on this home.
Original Mortgage
$834,604
Outstanding Balance
$832,363
Interest Rate
6.58%
Mortgage Type
FHA
Estimated Equity
-$48,486
Purchase Details
Closed on
Nov 22, 2004
Sold by
Galdamez Vilma
Bought by
Dorante Nancy
Home Financials for this Owner
Home Financials are based on the most recent Mortgage that was taken out on this home.
Original Mortgage
$356,250
Interest Rate
5.8%
Mortgage Type
Purchase Money Mortgage
Purchase Details
Closed on
Aug 20, 2004
Sold by
Landaverde Francisco
Bought by
Galdamez Vilma
Purchase Details
Closed on
Oct 31, 2002
Sold by
Doumit Ibrahim G
Bought by
Landaverde Francisco and Galdamez Vilma
Purchase Details
Closed on
Nov 3, 1997
Sold by
Saliba Hamid
Bought by
Doumit Ibrahim G
Create a Home Valuation Report for This Property
The Home Valuation Report is an in-depth analysis detailing your home's value as well as a comparison with similar homes in the area
Home Values in the Area
Average Home Value in this Area
Purchase History
| Date | Buyer | Sale Price | Title Company |
|---|---|---|---|
| Almonte-Rosario Juan C | $850,000 | -- | |
| Dorante Nancy | $375,000 | -- | |
| Dorante Nancy | $375,000 | -- | |
| Galdamez Vilma | -- | -- | |
| Galdamez Vilma | -- | -- | |
| Landaverde Francisco | $295,000 | -- | |
| Landaverde Francisco | $295,000 | -- | |
| Doumit Ibrahim G | $135,000 | -- | |
| Doumit Ibrahim G | $135,000 | -- |
Source: Public Records
Mortgage History
| Date | Status | Borrower | Loan Amount |
|---|---|---|---|
| Open | Almonte-Rosario Juan C | $834,604 | |
| Previous Owner | Dorante Nancy | $356,250 | |
| Previous Owner | Doumit Ibrahim G | $106,500 |
Source: Public Records
Tax History
| Year | Tax Paid | Tax Assessment Tax Assessment Total Assessment is a certain percentage of the fair market value that is determined by local assessors to be the total taxable value of land and additions on the property. | Land | Improvement |
|---|---|---|---|---|
| 2025 | $7,208 | $681,300 | $187,800 | $493,500 |
| 2024 | $6,490 | $597,600 | $164,200 | $433,400 |
| 2023 | $6,334 | $541,400 | $144,500 | $396,900 |
| 2022 | $5,715 | $437,900 | $118,200 | $319,700 |
| 2021 | $5,463 | $414,200 | $111,700 | $302,500 |
| 2020 | $5,220 | $388,400 | $111,700 | $276,700 |
| 2019 | $4,779 | $336,800 | $105,100 | $231,700 |
| 2018 | $4,419 | $309,700 | $98,500 | $211,200 |
| 2017 | $4,241 | $289,500 | $92,000 | $197,500 |
| 2016 | $3,859 | $260,600 | $85,400 | $175,200 |
| 2015 | $3,679 | $252,000 | $85,400 | $166,600 |
Source: Public Records
Map
Nearby Homes
- 20-22 Ashland Ave
- 7 Field Ave
- 24 Railroad St
- 20 Ruskin Ave
- 7-9 Carleton Ct
- 23 Bentley Cir
- 37 Maplewood Ave
- 9-11 Horne St
- 23 Chase St
- 29 Center St
- 36 Manchester St
- 82 Oakside Ave
- 65 Clayton Ave
- 179-181 West St
- 434-438 Hampshire St
- 27 Willow St Unit A
- 97 Kenwood Rd
- 10 Holly St
- 50 Forest St
- 42 Perley St
- 63 Arnold St Unit 2
- 71 Arnold St
- 24 Linton Ave
- 4 Linton Ave Unit 2
- 59 Arnold St Unit 61
- 68 Arnold St
- 6 Linton Ave
- 75 Arnold St
- 75 Arnold St Unit R
- 70 Arnold St
- 64 Arnold St
- 57 Arnold St
- 1 Linton Ave
- 72 Arnold St
- 77 Arnold St
- 58 Arnold St
- 10 Linton Ave Unit 12
- 79 Linton Ave
- 7-9 Linton Ave
- 74 Arnold St
Your Personal Tour Guide
Ask me questions while you tour the home.