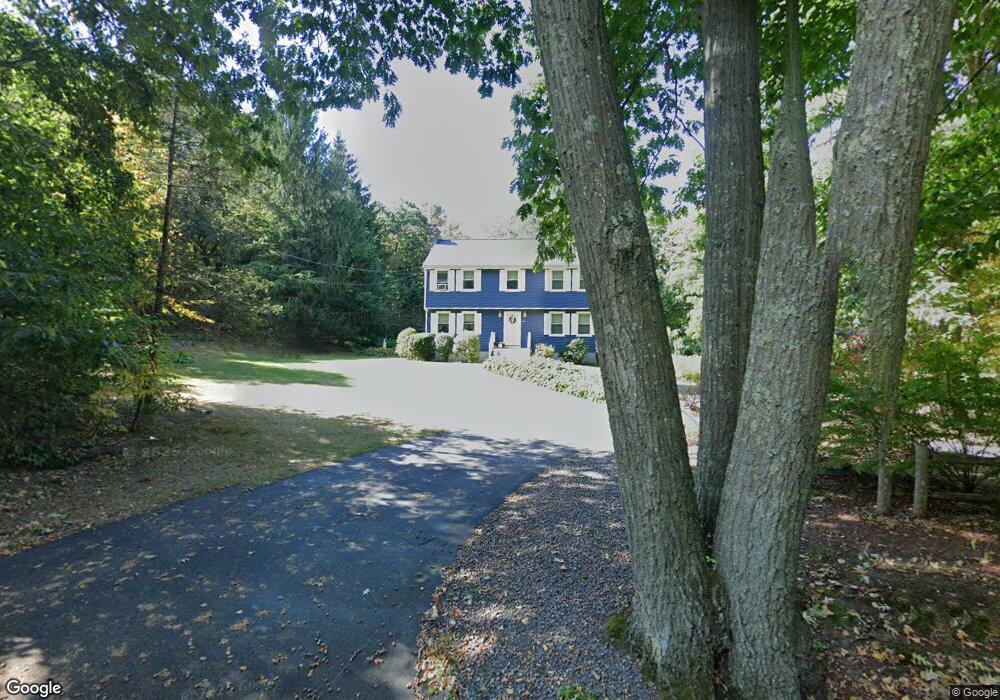
63 Bradford St North Andover, MA 01845
Estimated Value: $835,000 - $915,000
3
Beds
3
Baths
2,144
Sq Ft
$406/Sq Ft
Est. Value
About This Home
This home is located at 63 Bradford St, North Andover, MA 01845 and is currently estimated at $869,619, approximately $405 per square foot. 63 Bradford St is a home located in Essex County with nearby schools including Kittredge Elementary School, North Andover Middle School, and North Andover High School.
Ownership History
Date
Name
Owned For
Owner Type
Purchase Details
Closed on
Sep 12, 2016
Sold by
Moschetto Russell J and Valliere-Moschetto Karin
Bought by
Mosechetto Ft
Current Estimated Value
Purchase Details
Closed on
Jul 26, 2013
Sold by
Moschetto Samuel and Saracusa Nellie
Bought by
Cranfield Investments
Purchase Details
Closed on
Jan 20, 2004
Sold by
Moschetto Russell J
Bought by
Moschetto Karin and Valliere-Moschetto Karin
Purchase Details
Closed on
Jul 31, 1995
Sold by
Oconnor John K
Bought by
Moschetto Russell J
Purchase Details
Closed on
Nov 4, 1992
Sold by
Flintlock Inc
Bought by
Oconnor John K
Purchase Details
Closed on
Jun 12, 1992
Sold by
Lentz Jerry D
Bought by
Flintlock Inc
Create a Home Valuation Report for This Property
The Home Valuation Report is an in-depth analysis detailing your home's value as well as a comparison with similar homes in the area
Home Values in the Area
Average Home Value in this Area
Purchase History
| Date | Buyer | Sale Price | Title Company |
|---|---|---|---|
| Mosechetto Ft | -- | -- | |
| Cranfield Investments | $765,000 | -- | |
| Moschetto Karin | -- | -- | |
| Moschetto Russell J | $230,000 | -- | |
| Oconnor John K | $208,134 | -- | |
| Flintlock Inc | $76,900 | -- |
Source: Public Records
Mortgage History
| Date | Status | Borrower | Loan Amount |
|---|---|---|---|
| Previous Owner | Cranfield Investments | $1,060,500 | |
| Previous Owner | Cranfield Investments | $1,500,000 | |
| Previous Owner | Flintlock Inc | $50,000 | |
| Previous Owner | Flintlock Inc | $225,000 |
Source: Public Records
Tax History Compared to Growth
Tax History
| Year | Tax Paid | Tax Assessment Tax Assessment Total Assessment is a certain percentage of the fair market value that is determined by local assessors to be the total taxable value of land and additions on the property. | Land | Improvement |
|---|---|---|---|---|
| 2025 | $8,310 | $738,000 | $370,900 | $367,100 |
| 2024 | $7,874 | $710,000 | $349,100 | $360,900 |
| 2023 | $7,798 | $637,100 | $320,700 | $316,400 |
| 2022 | $7,557 | $558,500 | $288,000 | $270,500 |
| 2021 | $7,268 | $512,900 | $261,900 | $251,000 |
| 2020 | $7,047 | $512,900 | $261,900 | $251,000 |
| 2019 | $6,878 | $512,900 | $261,900 | $251,000 |
| 2018 | $7,452 | $512,900 | $261,900 | $251,000 |
| 2017 | $6,046 | $423,400 | $207,300 | $216,100 |
| 2016 | $5,724 | $401,100 | $203,400 | $197,700 |
| 2015 | $6,080 | $422,500 | $200,100 | $222,400 |
Source: Public Records
Map
Nearby Homes
- 128 Bradford St
- 107 Farrwood Dr Unit 107
- 406 Farrwood Dr Unit 406
- 414 Farrwood Dr Unit 414
- 369 Farrwood Dr
- 61 Thornton Ave
- 45 Christopher Dr Unit 101
- 87 French Farm Rd
- 29 Pitman St
- 49 Golf Ave
- 29 Wallace St
- 2 Goodrich Ave
- 0 Great Pond Rd
- 17 Ferry Rd
- 28 Riverview Blvd
- 10 Albermarle St
- 22 Derry Rd
- 35 Bonny Ln
- 115 Merrimack Rd
- 40 Comet Rd
- 55 Bradford St
- 29 White Birch Ln
- 81 Bradford St
- 80 Bradford St
- 31 Bradford St
- 37 White Birch Ln
- 97 Bradford St
- 90 Bradford St
- 16-4 Stanton Way
- 45 White Birch Ln
- Lot 16-8 Stanton Way
- 46 White Birch Ln
- 38 White Birch Ln
- 53 White Birch Ln
- 102 Bradford St
- 10 Cherise Cir
- 26 Stanton Way
- Lot-16-7 Stanton Way
- 27 Bradford St
- 30 Stanton Way