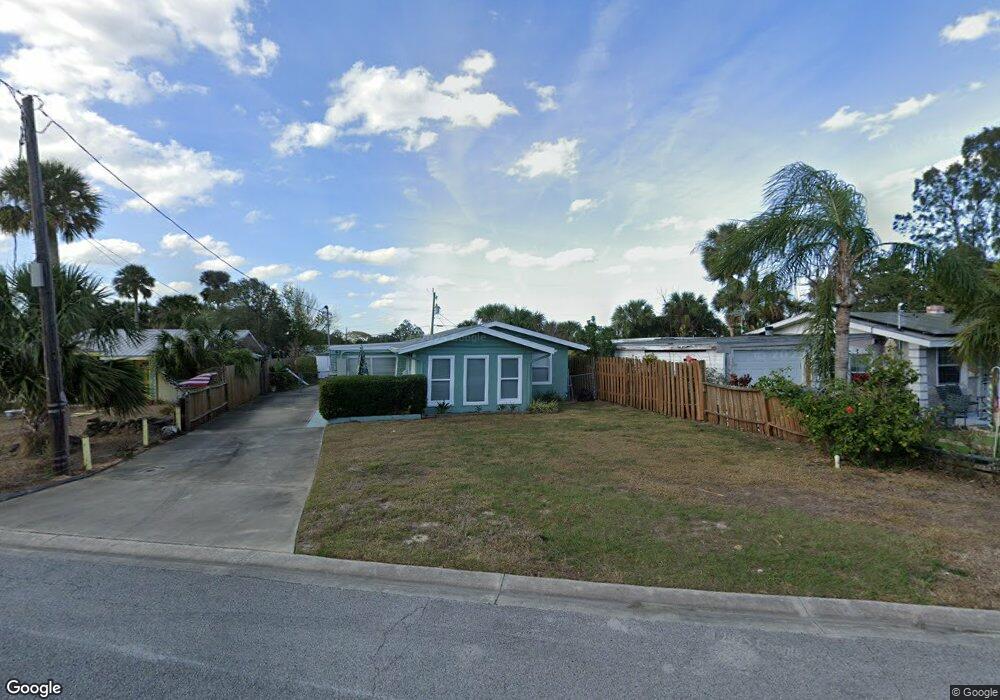
63 Brooks Dr Ormond Beach, FL 32176
Estimated Value: $230,000 - $272,000
2
Beds
1
Bath
840
Sq Ft
$294/Sq Ft
Est. Value
About This Home
This home is located at 63 Brooks Dr, Ormond Beach, FL 32176 and is currently estimated at $247,003, approximately $294 per square foot. 63 Brooks Dr is a home located in Volusia County with nearby schools including Ormond Beach Middle School, Seabreeze High School, and St Brendan Catholic School.
Ownership History
Date
Name
Owned For
Owner Type
Purchase Details
Closed on
Feb 11, 2004
Sold by
Taylor Chad M and Taylor Tara R
Bought by
Eskew Carl W and Eskew Shirley J
Current Estimated Value
Purchase Details
Closed on
Sep 6, 1996
Sold by
Cowher Stella A and Cowher Stella H
Bought by
Taylor Chad M and Tayor Tara R
Home Financials for this Owner
Home Financials are based on the most recent Mortgage that was taken out on this home.
Original Mortgage
$40,750
Interest Rate
8.21%
Purchase Details
Closed on
Jul 9, 1996
Sold by
Cowher Earl
Bought by
Cowher Stella A and Cowher Stella H
Home Financials for this Owner
Home Financials are based on the most recent Mortgage that was taken out on this home.
Original Mortgage
$40,750
Interest Rate
8.21%
Purchase Details
Closed on
Nov 15, 1977
Bought by
Eskew Carl W and Eskew Shirley J
Create a Home Valuation Report for This Property
The Home Valuation Report is an in-depth analysis detailing your home's value as well as a comparison with similar homes in the area
Home Values in the Area
Average Home Value in this Area
Purchase History
| Date | Buyer | Sale Price | Title Company |
|---|---|---|---|
| Eskew Carl W | $125,000 | -- | |
| Taylor Chad M | $42,900 | -- | |
| Cowher Stella A | -- | -- | |
| Eskew Carl W | $29,500 | -- |
Source: Public Records
Mortgage History
| Date | Status | Borrower | Loan Amount |
|---|---|---|---|
| Previous Owner | Taylor Chad M | $40,750 |
Source: Public Records
Tax History
| Year | Tax Paid | Tax Assessment Tax Assessment Total Assessment is a certain percentage of the fair market value that is determined by local assessors to be the total taxable value of land and additions on the property. | Land | Improvement |
|---|---|---|---|---|
| 2026 | $1,416 | $103,578 | -- | -- |
| 2025 | $1,416 | $100,855 | -- | -- |
| 2024 | $1,319 | $98,013 | -- | -- |
| 2023 | $1,319 | $95,159 | $0 | $0 |
| 2022 | $1,260 | $92,387 | $0 | $0 |
| 2021 | $1,269 | $89,696 | $0 | $0 |
| 2020 | $1,241 | $88,458 | $0 | $0 |
| 2019 | $1,218 | $86,469 | $0 | $0 |
| 2018 | $1,188 | $84,857 | $0 | $0 |
| 2017 | $1,152 | $83,112 | $0 | $0 |
| 2016 | $1,127 | $81,403 | $0 | $0 |
| 2015 | $1,147 | $80,837 | $0 | $0 |
| 2014 | $1,124 | $80,195 | $0 | $0 |
Source: Public Records
Map
Nearby Homes
- 62 Brooks Dr
- 73 Brooks Dr
- 41 Brooks Dr
- 108 Essex Dr
- 1210 John Anderson Dr
- 107 Lynnhurst Dr
- 213 Lynnhurst Dr
- 14 Essex Dr
- 10 Lynnhurst Dr Unit 214
- 32 Plaza Dr
- 7 Sunny Shore Dr
- 126 Longwood Dr
- 4 Sunny Shore Dr
- 128 Longwood Dr
- 22 Plaza Dr
- 1351 John Anderson Dr
- 15 Plaza Dr
- 7 River Dr
- 115 Longwood Dr
- 26 Hibiscus Dr
Your Personal Tour Guide
Ask me questions while you tour the home.