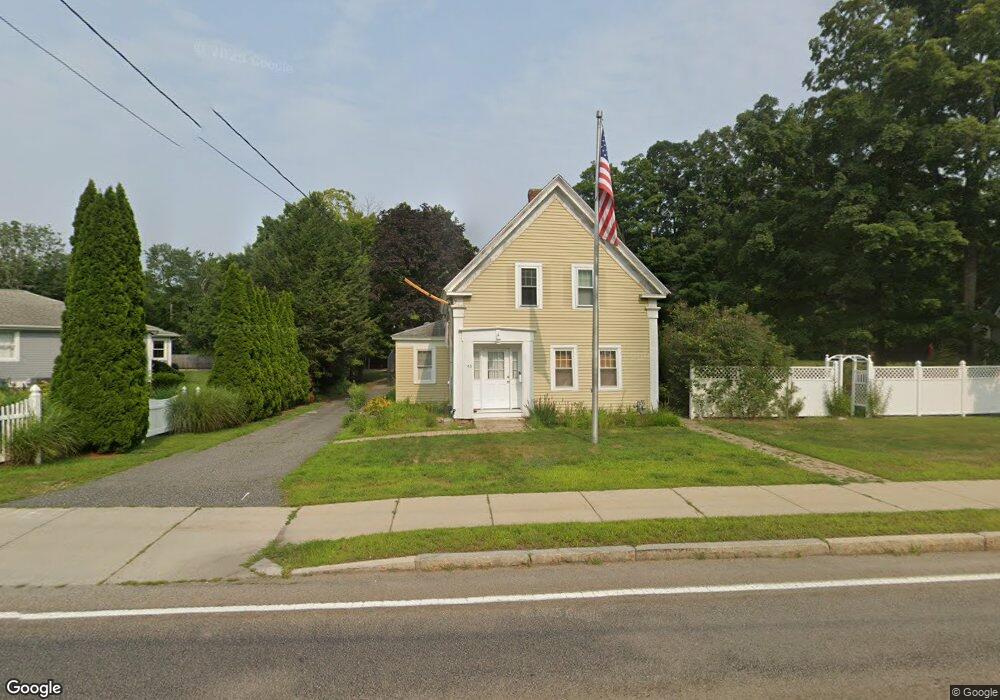
63 Concord St Holliston, MA 01746
Estimated Value: $538,000 - $619,093
3
Beds
3
Baths
1,401
Sq Ft
$405/Sq Ft
Est. Value
About This Home
This home is located at 63 Concord St, Holliston, MA 01746 and is currently estimated at $566,773, approximately $404 per square foot. 63 Concord St is a home located in Middlesex County with nearby schools including Miller Elementary School, Robert H. Adams Middle School, and Holliston High School.
Ownership History
Date
Name
Owned For
Owner Type
Purchase Details
Closed on
Aug 22, 2025
Sold by
Hill Peter
Bought by
Frechette Eric M
Current Estimated Value
Home Financials for this Owner
Home Financials are based on the most recent Mortgage that was taken out on this home.
Original Mortgage
$420,000
Outstanding Balance
$418,903
Interest Rate
6.72%
Mortgage Type
New Conventional
Estimated Equity
$147,870
Purchase Details
Closed on
Aug 27, 2021
Sold by
Hill Vicki
Bought by
Hill Peter
Home Financials for this Owner
Home Financials are based on the most recent Mortgage that was taken out on this home.
Original Mortgage
$200,000
Interest Rate
2.8%
Mortgage Type
New Conventional
Purchase Details
Closed on
Jun 15, 2010
Sold by
Hill Peter H
Bought by
Hill Peter and Hill Vicki
Home Financials for this Owner
Home Financials are based on the most recent Mortgage that was taken out on this home.
Original Mortgage
$306,506
Interest Rate
5.11%
Mortgage Type
Purchase Money Mortgage
Purchase Details
Closed on
Apr 12, 1996
Sold by
Hill Dorothy M Est and Crampton
Bought by
Hill Peter H
Create a Home Valuation Report for This Property
The Home Valuation Report is an in-depth analysis detailing your home's value as well as a comparison with similar homes in the area
Home Values in the Area
Average Home Value in this Area
Purchase History
| Date | Buyer | Sale Price | Title Company |
|---|---|---|---|
| Frechette Eric M | $535,000 | -- | |
| Frechette Eric M | $535,000 | -- | |
| Hill Peter | -- | None Available | |
| Hill Peter | -- | None Available | |
| Hill Peter | -- | None Available | |
| Hill Peter | -- | -- | |
| Hill Peter | -- | -- | |
| Hill Peter H | $72,000 | -- | |
| Hill Peter | -- | -- | |
| Hill Peter H | $72,000 | -- |
Source: Public Records
Mortgage History
| Date | Status | Borrower | Loan Amount |
|---|---|---|---|
| Open | Frechette Eric M | $420,000 | |
| Closed | Frechette Eric M | $420,000 | |
| Previous Owner | Hill Peter | $200,000 | |
| Previous Owner | Hill Peter | $306,506 |
Source: Public Records
Tax History Compared to Growth
Tax History
| Year | Tax Paid | Tax Assessment Tax Assessment Total Assessment is a certain percentage of the fair market value that is determined by local assessors to be the total taxable value of land and additions on the property. | Land | Improvement |
|---|---|---|---|---|
| 2025 | $6,667 | $455,100 | $270,600 | $184,500 |
| 2024 | $6,459 | $428,900 | $270,600 | $158,300 |
| 2023 | $5,262 | $341,700 | $225,500 | $116,200 |
| 2022 | $5,628 | $323,800 | $225,500 | $98,300 |
| 2021 | $5,999 | $336,100 | $226,300 | $109,800 |
| 2020 | $6,024 | $319,600 | $224,900 | $94,700 |
| 2019 | $5,660 | $300,600 | $195,700 | $104,900 |
| 2018 | $5,612 | $300,600 | $195,700 | $104,900 |
| 2017 | $5,250 | $283,500 | $188,000 | $95,500 |
| 2016 | $5,475 | $291,400 | $188,000 | $103,400 |
| 2015 | $5,048 | $260,500 | $145,900 | $114,600 |
Source: Public Records
Map
Nearby Homes
- 11 Francine Dr
- 160 Winter St
- 195 High St
- 54 Westfield Dr
- 56 Roy Ave
- 43 Bittersweet Cir Unit 43
- 32 Colonial Way
- 131 Jennings Rd
- 133 Brooksmont Dr Unit 43
- 95 Brooksmont Dr Unit 26
- 150 Westfield Dr
- 1366 Washington St
- 107 Richard Rd
- 59 Turner Rd
- 151 Mohawk Path
- 154 Union St
- 156 Mitchell Rd
- 6 Brook St
- 1014 Highland St
- 152 Turner Rd Unit 43