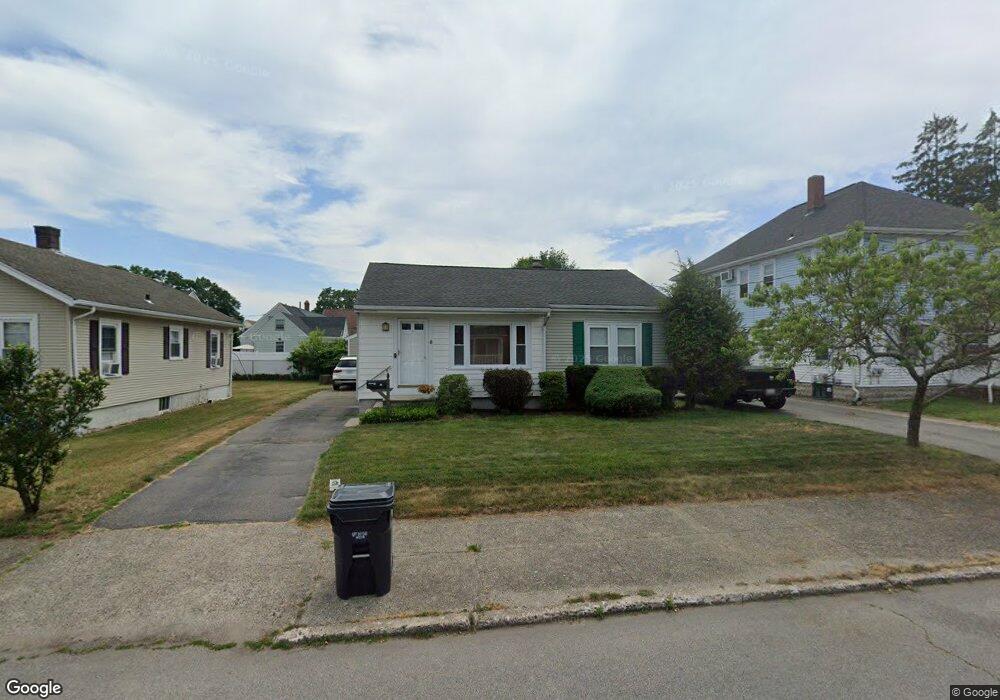
63 Crescent Rd Pawtucket, RI 02861
Darlington NeighborhoodEstimated Value: $327,000 - $400,000
2
Beds
1
Bath
1,392
Sq Ft
$271/Sq Ft
Est. Value
About This Home
This home is located at 63 Crescent Rd, Pawtucket, RI 02861 and is currently estimated at $376,846, approximately $270 per square foot. 63 Crescent Rd is a home located in Providence County with nearby schools including St Cecilia School and Saint Teresa Catholic Elementary School.
Ownership History
Date
Name
Owned For
Owner Type
Purchase Details
Closed on
Dec 28, 2016
Sold by
Hefner Elizabeth A
Bought by
Hefner Elizabeth A and Hefer Michael A
Current Estimated Value
Purchase Details
Closed on
Oct 28, 2011
Sold by
Hanewich Manon M and Hanewich William J
Bought by
Ciccio Elizabeth A
Home Financials for this Owner
Home Financials are based on the most recent Mortgage that was taken out on this home.
Original Mortgage
$206,000
Interest Rate
4.11%
Mortgage Type
Purchase Money Mortgage
Purchase Details
Closed on
Oct 26, 2011
Sold by
Macarthur Leith C
Bought by
Zanecchia Paul M
Home Financials for this Owner
Home Financials are based on the most recent Mortgage that was taken out on this home.
Original Mortgage
$206,000
Interest Rate
4.11%
Mortgage Type
Purchase Money Mortgage
Purchase Details
Closed on
Mar 18, 2011
Sold by
Deacon Linnea M
Bought by
Hanewich Manon M and Hanewich William J
Create a Home Valuation Report for This Property
The Home Valuation Report is an in-depth analysis detailing your home's value as well as a comparison with similar homes in the area
Home Values in the Area
Average Home Value in this Area
Purchase History
| Date | Buyer | Sale Price | Title Company |
|---|---|---|---|
| Hefner Elizabeth A | -- | -- | |
| Ciccio Elizabeth A | $155,000 | -- | |
| Zanecchia Paul M | $275,000 | -- | |
| Hanewich Manon M | $95,000 | -- |
Source: Public Records
Mortgage History
| Date | Status | Borrower | Loan Amount |
|---|---|---|---|
| Previous Owner | Hanewich Manon M | $206,000 |
Source: Public Records
Tax History
| Year | Tax Paid | Tax Assessment Tax Assessment Total Assessment is a certain percentage of the fair market value that is determined by local assessors to be the total taxable value of land and additions on the property. | Land | Improvement |
|---|---|---|---|---|
| 2025 | $3,981 | $302,700 | $136,500 | $166,200 |
| 2024 | $3,735 | $302,700 | $136,500 | $166,200 |
| 2023 | $3,573 | $210,900 | $80,900 | $130,000 |
| 2022 | $3,497 | $210,900 | $80,900 | $130,000 |
| 2021 | $3,497 | $210,900 | $80,900 | $130,000 |
| 2020 | $3,741 | $179,100 | $77,500 | $101,600 |
| 2019 | $3,741 | $179,100 | $77,500 | $101,600 |
| 2018 | $3,605 | $179,100 | $77,500 | $101,600 |
| 2017 | $3,256 | $143,300 | $55,600 | $87,700 |
| 2016 | $3,137 | $143,300 | $55,600 | $87,700 |
| 2015 | $3,137 | $143,300 | $55,600 | $87,700 |
| 2014 | $2,887 | $125,200 | $49,700 | $75,500 |
Source: Public Records
Map
Nearby Homes
Your Personal Tour Guide
Ask me questions while you tour the home.