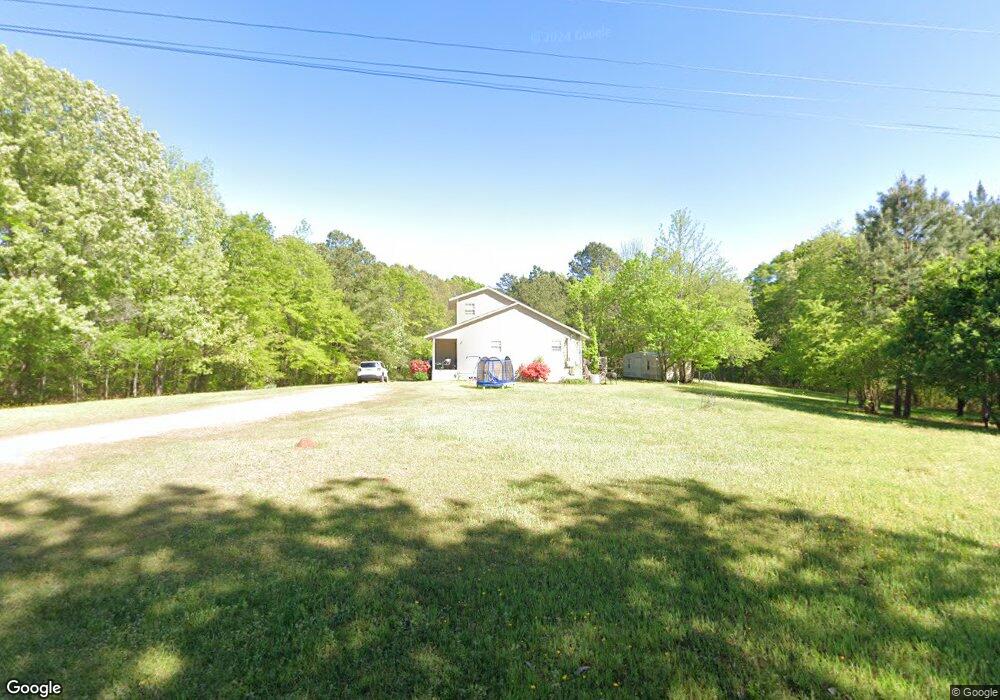
63 Cuevas Rd West Point, MS 39773
Estimated Value: $152,000 - $213,000
3
Beds
2
Baths
1,495
Sq Ft
$128/Sq Ft
Est. Value
About This Home
This home is located at 63 Cuevas Rd, West Point, MS 39773 and is currently estimated at $190,740, approximately $127 per square foot. 63 Cuevas Rd is a home located in Clay County with nearby schools including East Side Elementary School, West Clay Elementary School, and Church Hill Elementary School.
Ownership History
Date
Name
Owned For
Owner Type
Purchase Details
Closed on
Nov 19, 2023
Sold by
Pratt Hill Wanda and Pratt Juanita Mays
Bought by
Mcmillian Caldon
Current Estimated Value
Purchase Details
Closed on
Feb 16, 2023
Sold by
White Corey Lynn
Bought by
Harris Clarissa Nicole
Home Financials for this Owner
Home Financials are based on the most recent Mortgage that was taken out on this home.
Original Mortgage
$7,000
Interest Rate
5.89%
Purchase Details
Closed on
Jun 26, 2017
Sold by
Duckworth Frank and Duckworth Beverly Murphy
Bought by
White Corey Lynn
Home Financials for this Owner
Home Financials are based on the most recent Mortgage that was taken out on this home.
Original Mortgage
$106,060
Interest Rate
3.95%
Mortgage Type
New Conventional
Create a Home Valuation Report for This Property
The Home Valuation Report is an in-depth analysis detailing your home's value as well as a comparison with similar homes in the area
Home Values in the Area
Average Home Value in this Area
Purchase History
| Date | Buyer | Sale Price | Title Company |
|---|---|---|---|
| Mcmillian Caldon | -- | None Listed On Document | |
| Harris Clarissa Nicole | -- | -- | |
| White Corey Lynn | -- | -- |
Source: Public Records
Mortgage History
| Date | Status | Borrower | Loan Amount |
|---|---|---|---|
| Previous Owner | Harris Clarissa Nicole | $7,000 | |
| Previous Owner | Harris Clarissa Nicole | $170,940 | |
| Previous Owner | White Corey Lynn | $106,060 |
Source: Public Records
Tax History Compared to Growth
Tax History
| Year | Tax Paid | Tax Assessment Tax Assessment Total Assessment is a certain percentage of the fair market value that is determined by local assessors to be the total taxable value of land and additions on the property. | Land | Improvement |
|---|---|---|---|---|
| 2024 | $830 | $14,757 | $2,280 | $12,477 |
| 2023 | $641 | $8,293 | $1,520 | $6,773 |
| 2022 | $309 | $8,293 | $1,520 | $6,773 |
| 2021 | $308 | $8,293 | $1,520 | $6,773 |
| 2020 | $308 | $8,293 | $1,520 | $6,773 |
| 2019 | $305 | $8,654 | $1,520 | $7,134 |
| 2018 | $286 | $8,654 | $1,520 | $7,134 |
| 2017 | $655 | $12,981 | $2,280 | $10,701 |
| 2016 | $632 | $12,981 | $2,280 | $10,701 |
| 2015 | $589 | $11,689 | $2,280 | $9,409 |
| 2014 | $212 | $11,689 | $2,280 | $9,409 |
| 2013 | $212 | $11,689 | $2,280 | $9,409 |
Source: Public Records
Map
Nearby Homes
- 164 Deer Run Rd
- 0 Riverchase Dr
- 1873 Sandy Land Rd
- 120 Nelda Dr
- 230 Acorn Aly
- 4595 Barton Ferry Rd
- 4134 Barton Ferry Rd
- 12 Clisby Rd
- 4 Clisby Rd
- 6 Clisby Rd
- 0 Pinkerton Rd
- 5600 Old Vinton Rd Unit West Point MS 39773
- 5 Clisby Rd
- 13 Clisby Rd
- 0 Mississippi 373
- 0 Dogwood Dr (Lot 21) Unit 24-279
- 0 Dogwood Dr (Lot 20) Unit 24-278
- 1372 Mike Parra Rd
- 0 Dogwood Dr (Lot 14) Unit 24-277
- 0 Dogwood Dr
- 1330 Town Creek Rd
- 135 Cuevas Rd
- 1228 Town Creek Rd
- 1500 Town Creek Rd
- 1233 Town Creek Rd
- 1653 Town Creek Rd
- 85 Witherspoon Loop
- 144 Witherspoon Loop
- 149 Witherspoon Loop
- 231 Witherspoon Loop
- 111 Deerrun Ln
- 332 Campground Rd
- 1871 Town Creek Rd
- 273 Witherspoon Rd
- 1043 Town Creek Rd
- 61 Deerrun Ln
- 199 Deerrun Rd E
- 1786 Town Creek Rd
- 873 Town Creek Rd
- 51 Deerrun Rd E