63 Depot St Sabattus, ME 04280
Estimated Value: $402,000 - $463,000
3
Beds
3
Baths
1,920
Sq Ft
$223/Sq Ft
Est. Value
About This Home
This home is located at 63 Depot St, Sabattus, ME 04280 and is currently estimated at $428,369, approximately $223 per square foot. 63 Depot St is a home with nearby schools including Carrie Ricker School, Oak Hill Middle School, and Oak Hill High School.
Ownership History
Date
Name
Owned For
Owner Type
Purchase Details
Closed on
Jul 7, 2016
Sold by
Dennis Michael
Bought by
Knowles Sharyn M
Current Estimated Value
Purchase Details
Closed on
Sep 18, 2012
Sold by
Dennis Michael
Bought by
Dennis Michael and Knowles Sharyn M
Create a Home Valuation Report for This Property
The Home Valuation Report is an in-depth analysis detailing your home's value as well as a comparison with similar homes in the area
Home Values in the Area
Average Home Value in this Area
Purchase History
| Date | Buyer | Sale Price | Title Company |
|---|---|---|---|
| Knowles Sharyn M | -- | -- | |
| Dennis Michael | -- | -- | |
| Dennis Michael | -- | -- |
Source: Public Records
Tax History
| Year | Tax Paid | Tax Assessment Tax Assessment Total Assessment is a certain percentage of the fair market value that is determined by local assessors to be the total taxable value of land and additions on the property. | Land | Improvement |
|---|---|---|---|---|
| 2024 | $5,102 | $267,100 | $28,400 | $238,700 |
| 2023 | $4,875 | $267,100 | $28,400 | $238,700 |
| 2022 | $4,447 | $267,100 | $28,400 | $238,700 |
| 2021 | $4,193 | $267,100 | $28,400 | $238,700 |
| 2020 | $1,926 | $260,300 | $28,400 | $231,900 |
| 2019 | $1,837 | $241,800 | $28,400 | $213,400 |
| 2018 | $4,292 | $241,800 | $28,400 | $213,400 |
| 2017 | $4,292 | $241,800 | $28,400 | $213,400 |
| 2016 | $447 | $241,800 | $28,400 | $213,400 |
| 2014 | $4,304 | $241,800 | $28,400 | $213,400 |
| 2013 | $1,990 | $121,700 | $28,400 | $93,300 |
Source: Public Records
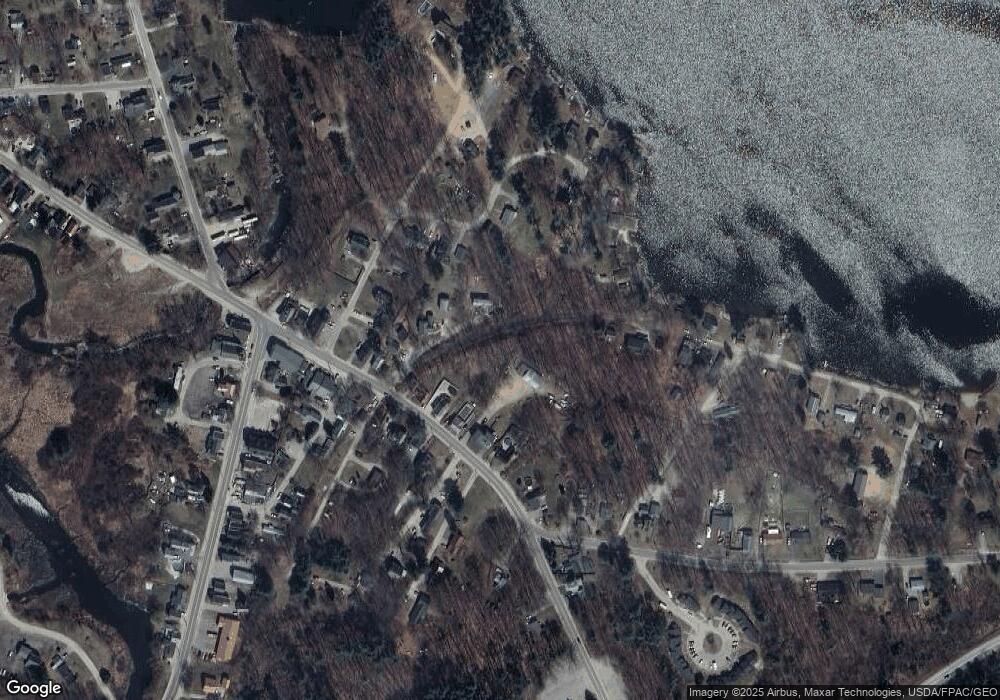
Map
Nearby Homes
Your Personal Tour Guide
Ask me questions while you tour the home.