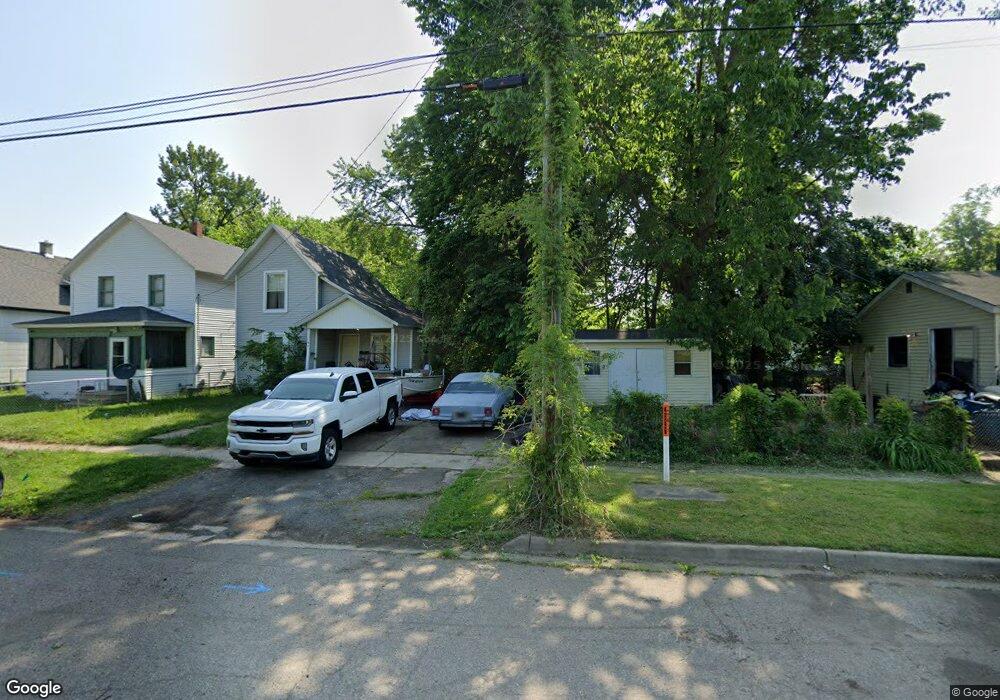
63 Euclid St Battle Creek, MI 49014
Post Franklin NeighborhoodEstimated Value: $82,235 - $103,000
2
Beds
1
Bath
1,053
Sq Ft
$85/Sq Ft
Est. Value
About This Home
This home is located at 63 Euclid St, Battle Creek, MI 49014 and is currently estimated at $89,309, approximately $84 per square foot. 63 Euclid St is a home located in Calhoun County with nearby schools including Post-Franklin Elementary School, Springfield Middle School, and Battle Creek Central High School.
Ownership History
Date
Name
Owned For
Owner Type
Purchase Details
Closed on
Dec 21, 2007
Sold by
Skydanyuk Vasyl and Skydanyuk Lidiya
Bought by
Skydanyuk Alla
Current Estimated Value
Home Financials for this Owner
Home Financials are based on the most recent Mortgage that was taken out on this home.
Original Mortgage
$37,000
Outstanding Balance
$23,383
Interest Rate
6.27%
Mortgage Type
Purchase Money Mortgage
Estimated Equity
$65,926
Purchase Details
Closed on
Jun 22, 2007
Sold by
Camisa Leslie A
Bought by
Deutsche Bank National Trust Co and Asset Backed Securities Corp Long Beach
Purchase Details
Closed on
May 30, 1997
Bought by
Camisa
Purchase Details
Closed on
May 9, 1997
Bought by
Thill
Purchase Details
Closed on
Jan 15, 1995
Bought by
Camisa
Create a Home Valuation Report for This Property
The Home Valuation Report is an in-depth analysis detailing your home's value as well as a comparison with similar homes in the area
Home Values in the Area
Average Home Value in this Area
Purchase History
| Date | Buyer | Sale Price | Title Company |
|---|---|---|---|
| Skydanyuk Alla | $37,000 | First American Title Ins Co | |
| Deutsche Bank National Trust Co | $35,591 | None Available | |
| Camisa | -- | -- | |
| Thill | $10,000 | -- | |
| Camisa | -- | -- |
Source: Public Records
Mortgage History
| Date | Status | Borrower | Loan Amount |
|---|---|---|---|
| Open | Skydanyuk Alla | $37,000 |
Source: Public Records
Tax History Compared to Growth
Tax History
| Year | Tax Paid | Tax Assessment Tax Assessment Total Assessment is a certain percentage of the fair market value that is determined by local assessors to be the total taxable value of land and additions on the property. | Land | Improvement |
|---|---|---|---|---|
| 2025 | -- | $27,400 | $0 | $0 |
| 2024 | $720 | $23,188 | $0 | $0 |
| 2023 | $916 | $21,242 | $0 | $0 |
| 2022 | $651 | $16,584 | $0 | $0 |
| 2021 | $870 | $15,605 | $0 | $0 |
| 2020 | $820 | $15,519 | $0 | $0 |
| 2019 | $815 | $14,467 | $0 | $0 |
| 2018 | $815 | $13,113 | $350 | $12,763 |
| 2017 | $794 | $13,043 | $0 | $0 |
| 2016 | $792 | $14,264 | $0 | $0 |
| 2015 | $776 | $15,914 | $1,638 | $14,276 |
| 2014 | $776 | $12,076 | $1,638 | $10,438 |
Source: Public Records
Map
Nearby Homes