63 Fossil Ridge Ct Wilmington, IL 60481
Estimated Value: $98,298 - $133,000
1
Bed
1
Bath
500
Sq Ft
$238/Sq Ft
Est. Value
About This Home
This home is located at 63 Fossil Ridge Ct, Wilmington, IL 60481 and is currently estimated at $119,099, approximately $238 per square foot. 63 Fossil Ridge Ct is a home located in Will County with nearby schools including Reed-Custer Intermediate School, Reed-Custer Middle School, and Reed-Custer High School.
Ownership History
Date
Name
Owned For
Owner Type
Purchase Details
Closed on
Jun 28, 2019
Sold by
Huckabay Raymond E and Huckabay Cheryl A
Bought by
Reynolds Shirley
Current Estimated Value
Purchase Details
Closed on
Apr 14, 2003
Sold by
Lasalle Bank Na
Bought by
Huckabay Raymond E and Huckabay Cheryl A
Home Financials for this Owner
Home Financials are based on the most recent Mortgage that was taken out on this home.
Original Mortgage
$60,000
Interest Rate
9.55%
Mortgage Type
Purchase Money Mortgage
Create a Home Valuation Report for This Property
The Home Valuation Report is an in-depth analysis detailing your home's value as well as a comparison with similar homes in the area
Home Values in the Area
Average Home Value in this Area
Purchase History
| Date | Buyer | Sale Price | Title Company |
|---|---|---|---|
| Reynolds Shirley | $50,000 | Fidelity National Title Ins | |
| Huckabay Raymond E | $22,000 | -- |
Source: Public Records
Mortgage History
| Date | Status | Borrower | Loan Amount |
|---|---|---|---|
| Previous Owner | Huckabay Raymond E | $60,000 |
Source: Public Records
Tax History Compared to Growth
Tax History
| Year | Tax Paid | Tax Assessment Tax Assessment Total Assessment is a certain percentage of the fair market value that is determined by local assessors to be the total taxable value of land and additions on the property. | Land | Improvement |
|---|---|---|---|---|
| 2024 | $990 | $22,493 | $11,446 | $11,047 |
| 2023 | $990 | $20,146 | $10,252 | $9,894 |
| 2022 | $866 | $18,281 | $9,303 | $8,978 |
| 2021 | $1,241 | $17,448 | $8,879 | $8,569 |
| 2020 | $1,180 | $16,530 | $8,412 | $8,118 |
| 2019 | $755 | $10,569 | $7,943 | $2,626 |
| 2018 | $729 | $10,114 | $7,601 | $2,513 |
| 2017 | $717 | $9,916 | $7,452 | $2,464 |
| 2016 | $701 | $9,590 | $7,207 | $2,383 |
| 2015 | $676 | $9,342 | $7,021 | $2,321 |
| 2014 | $676 | $9,342 | $7,021 | $2,321 |
| 2013 | $676 | $9,991 | $7,509 | $2,482 |
Source: Public Records
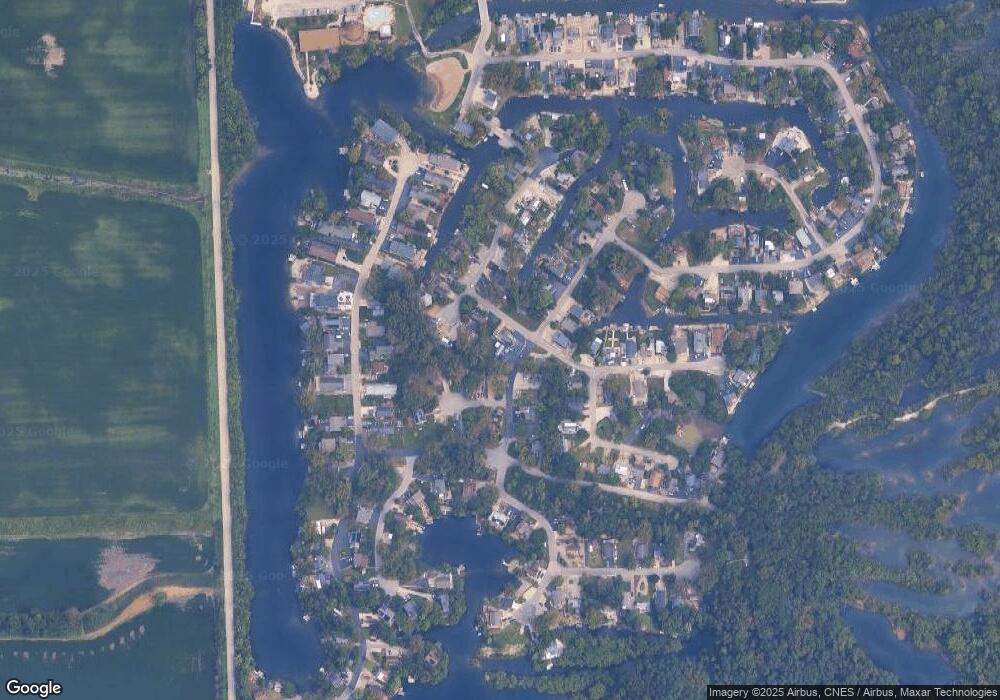
Map
Nearby Homes
- 64 Fossil Ridge Rd
- 68 Fossil Cove Ln
- 134 Fossil Lake Rd
- 271 Fossil Bay Ct
- 170 Fossil Cove Ln
- 225 Fossil Cove Ln
- 193 Tummy Tooth Ln
- 13 Hole in The Wall Rd
- 79 Dinosaur Rd
- 82 Dinosaur Rd
- 124 Tully Rd
- 72 Largemouth Ln
- 211 Walleye Cir
- 46 Lakeshore Dr
- 131 Dogwood Ln
- 113 Largemouth Ln
- 106 Harbor Landing
- 000 W Cermak Rd
- 8 Bluegill Cir
- 560 N Washington St
- 62 Fossil Ridge Ct
- 66 Fossil Cove Ln
- 61 Fossil Ridge Ct
- 113 Fossil Ridge Rd
- 65 Fossil Cove Ln
- 114 Fossil Ridge Rd
- 115 Fossil Ridge Rd
- 67 Fossil Cove Ln
- 92 Fossil Ridge Rd
- 53 Fossil Cove Ln
- 90 Fossil Cove Ln
- 116 Fossil Ridge Rd
- 89 Fossil Cove Ln
- 111 Fossil Ridge Rd
- 54 Fossil Ridge Ct
- 137 Fossil Lake Ct
- 55 Fossil Ridge Ct
- 70 Fossil Cove Ln
- 117 Fossil Ridge Rd
- 110 Fossil Ridge Rd