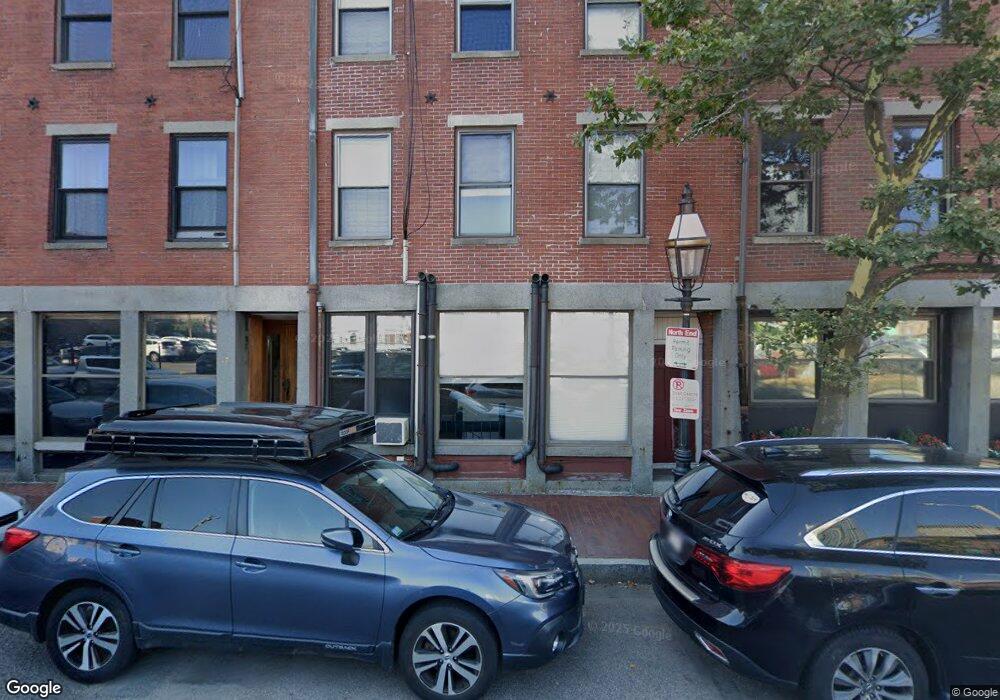
63 Fulton St Unit 12 Boston, MA 02109
North End NeighborhoodEstimated Value: $1,040,000 - $1,439,000
1
Bed
2
Baths
1,264
Sq Ft
$951/Sq Ft
Est. Value
About This Home
This home is located at 63 Fulton St Unit 12, Boston, MA 02109 and is currently estimated at $1,202,169, approximately $951 per square foot. 63 Fulton St Unit 12 is a home located in Suffolk County with nearby schools including St John School, Boston Children's School, and Torit Montessori School.
Ownership History
Date
Name
Owned For
Owner Type
Purchase Details
Closed on
Sep 21, 2018
Sold by
Mierzejewski 3Rd Joseph and Mierzejewski Kourtney
Bought by
Stella Michael and Stella William J
Current Estimated Value
Purchase Details
Closed on
Jan 7, 2014
Sold by
Massari Anhtony
Bought by
Mierzejewski 3Rd Joseph and Thomas Kourtney
Home Financials for this Owner
Home Financials are based on the most recent Mortgage that was taken out on this home.
Original Mortgage
$417,000
Interest Rate
4.24%
Mortgage Type
New Conventional
Purchase Details
Closed on
Mar 21, 2002
Sold by
Granner Nikki R
Bought by
Massari Anthony
Purchase Details
Closed on
Aug 7, 1998
Sold by
Glynn Mary A
Bought by
Granner Nikki R
Purchase Details
Closed on
Nov 20, 1992
Sold by
Miles Clayton J
Bought by
Glynn Mary A
Create a Home Valuation Report for This Property
The Home Valuation Report is an in-depth analysis detailing your home's value as well as a comparison with similar homes in the area
Home Values in the Area
Average Home Value in this Area
Purchase History
| Date | Buyer | Sale Price | Title Company |
|---|---|---|---|
| Stella Michael | $1,078,000 | -- | |
| Mierzejewski 3Rd Joseph | $630,000 | -- | |
| Massari Anthony | $450,000 | -- | |
| Granner Nikki R | $322,500 | -- | |
| Glynn Mary A | $40,000 | -- | |
| Glynn Mary A | $163,500 | -- |
Source: Public Records
Mortgage History
| Date | Status | Borrower | Loan Amount |
|---|---|---|---|
| Previous Owner | Glynn Mary A | $417,000 | |
| Previous Owner | Glynn Mary A | $85,000 |
Source: Public Records
Tax History Compared to Growth
Tax History
| Year | Tax Paid | Tax Assessment Tax Assessment Total Assessment is a certain percentage of the fair market value that is determined by local assessors to be the total taxable value of land and additions on the property. | Land | Improvement |
|---|---|---|---|---|
| 2025 | $10,290 | $888,600 | $0 | $888,600 |
| 2024 | $9,556 | $876,700 | $0 | $876,700 |
| 2023 | $9,318 | $867,600 | $0 | $867,600 |
| 2022 | $9,076 | $834,200 | $0 | $834,200 |
| 2021 | $9,369 | $878,100 | $0 | $878,100 |
| 2020 | $9,615 | $910,500 | $0 | $910,500 |
| 2019 | $8,885 | $843,000 | $0 | $843,000 |
| 2018 | $8,414 | $802,900 | $0 | $802,900 |
| 2017 | $8,252 | $779,200 | $0 | $779,200 |
| 2016 | $8,249 | $749,900 | $0 | $749,900 |
| 2015 | $8,955 | $739,500 | $0 | $739,500 |
| 2014 | $8,366 | $665,000 | $0 | $665,000 |
Source: Public Records
Map
Nearby Homes
- 110-112 Commercial St Unit 2
- 110-112 Commercial St Unit 5
- 142 Commercial St Unit 503
- 170 Commercial St Unit 4
- 120 Fulton St Unit DE
- 120 Fulton St Unit 5 C&D
- 122-130 Fulton Unit 13
- 130 Fulton St Unit 16
- 63 Atlantic Ave Unit 9B
- 63 Atlantic Ave Unit 7E
- 220 Commercial St Unit 5A
- 290 North St Unit 4
- 1 Lewis Wharf
- 21 Moon St Unit 2
- 59 Commercial Wharf Unit 1
- 28 Atlantic Ave Unit 638
- 28 Atlantic Ave Unit 424
- 28 Atlantic Ave Unit 534
- 115 Salem St Unit 16
- 11 Wiget St Unit 11-4
- 63 Fulton St Unit 9
- 63 Fulton St Unit 8
- 63 Fulton St Unit 5
- 63 Fulton St Unit 2
- 57 Fulton St Unit 12
- 57 Fulton St Unit 1
- 57 Fulton St Unit 2
- 57 Fulton St Unit 4 - 57
- 57 Fulton St Unit 2,57
- 57 Fulton St Unit 10,57
- 57 Fulton St Unit A
- 57 Fulton St
- 57 Fulton St Unit 7
- 57 Fulton St Unit 11
- 57 Fulton St Unit 10
- 57 Fulton St Unit 6
- 57-63 Fulton St Unit 12
- 53 Fulton St Unit 5
- 53 Fulton St Unit 4
- 53 Fulton St Unit 3