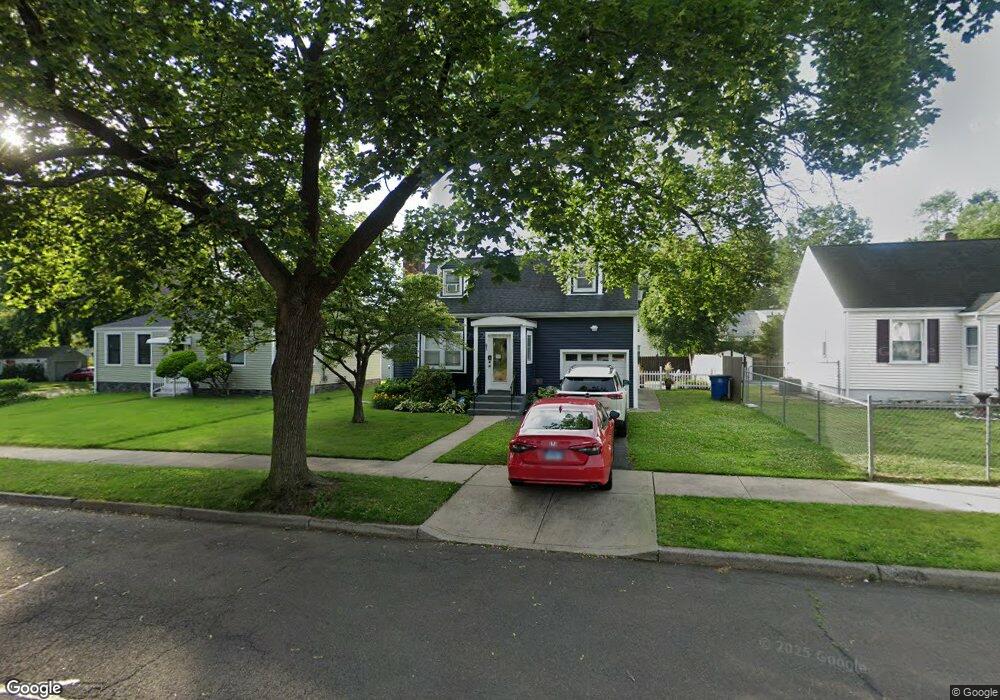
63 Glen View Terrace New Haven, CT 06515
Amity NeighborhoodEstimated Value: $288,000 - $324,000
3
Beds
3
Baths
1,182
Sq Ft
$257/Sq Ft
Est. Value
About This Home
This home is located at 63 Glen View Terrace, New Haven, CT 06515 and is currently estimated at $303,783, approximately $257 per square foot. 63 Glen View Terrace is a home located in New Haven County with nearby schools including Elm City Montessori School, Ezra Academy, and Hopkins School.
Ownership History
Date
Name
Owned For
Owner Type
Purchase Details
Closed on
Jun 4, 2022
Sold by
Rivera Enrique
Bought by
Rivera Enrique and Sepulveda Diermalys
Current Estimated Value
Home Financials for this Owner
Home Financials are based on the most recent Mortgage that was taken out on this home.
Original Mortgage
$211,640
Outstanding Balance
$201,376
Interest Rate
5.27%
Mortgage Type
FHA
Estimated Equity
$102,407
Purchase Details
Closed on
Apr 18, 2006
Sold by
Davis Peter and Jackson Rebecca
Bought by
Rivera Enrique
Home Financials for this Owner
Home Financials are based on the most recent Mortgage that was taken out on this home.
Original Mortgage
$210,105
Interest Rate
6.28%
Purchase Details
Closed on
Jul 23, 1987
Sold by
Rosenthal Michael W
Bought by
Decter Sheila R
Create a Home Valuation Report for This Property
The Home Valuation Report is an in-depth analysis detailing your home's value as well as a comparison with similar homes in the area
Home Values in the Area
Average Home Value in this Area
Purchase History
| Date | Buyer | Sale Price | Title Company |
|---|---|---|---|
| Rivera Enrique | -- | None Available | |
| Rivera Enrique | $214,000 | -- | |
| Rivera Enrique | $214,000 | -- | |
| Decter Sheila R | $140,000 | -- |
Source: Public Records
Mortgage History
| Date | Status | Borrower | Loan Amount |
|---|---|---|---|
| Open | Rivera Enrique | $211,640 | |
| Previous Owner | Decter Sheila R | $200,742 | |
| Previous Owner | Decter Sheila R | $212,812 | |
| Previous Owner | Decter Sheila R | $210,105 |
Source: Public Records
Tax History Compared to Growth
Tax History
| Year | Tax Paid | Tax Assessment Tax Assessment Total Assessment is a certain percentage of the fair market value that is determined by local assessors to be the total taxable value of land and additions on the property. | Land | Improvement |
|---|---|---|---|---|
| 2025 | $5,251 | $133,280 | $44,310 | $88,970 |
| 2024 | $5,131 | $133,280 | $44,310 | $88,970 |
| 2023 | $4,958 | $133,280 | $44,310 | $88,970 |
| 2022 | $5,298 | $133,280 | $44,310 | $88,970 |
| 2021 | $4,254 | $96,950 | $26,600 | $70,350 |
| 2020 | $4,254 | $96,950 | $26,600 | $70,350 |
| 2019 | $4,167 | $96,950 | $26,600 | $70,350 |
| 2018 | $4,167 | $96,950 | $26,600 | $70,350 |
| 2017 | $3,750 | $96,950 | $26,600 | $70,350 |
| 2016 | $3,932 | $94,640 | $26,600 | $68,040 |
| 2015 | $3,932 | $94,640 | $26,600 | $68,040 |
| 2014 | $3,932 | $94,640 | $26,600 | $68,040 |
Source: Public Records
Map
Nearby Homes
- 61 Anthony St
- 51 Fountain Terrace
- 20 Maplewood Rd
- 119 Brooklawn Cir
- 6 Victory Dr
- 136 Rock Creek Rd
- 360 Fountain St Unit 6
- 360 Fountain St Unit 5
- 18 Hilltop Rd
- 827 Fountain St
- 233 Valley St
- 57 Rock Creek Rd
- 1681 Litchfield Turnpike
- 120 Emerson St
- 12 Whisper Ridge Way Unit 45
- 12 Whisper Ridge Way
- 14 Whisper Ridge Way Unit 46
- 8 Whisper Ridge Way
- 999 Whalley Ave Unit 1H
- 6 Whisper Ridge Way Unit 42
- 57 Glen View Terrace
- 71 Glen View Terrace
- 52 Beverly Rd
- 51 Glen View Terrace
- 60 Beverly Rd
- 46 Beverly Rd
- 64 Glen View Terrace
- 79 Glen View Terrace
- 58 Glen View Terrace
- 45 Glen View Terrace
- 70 Glen View Terrace
- 34 Beverly Rd
- 68 Beverly Rd
- 52 Glen View Terrace
- 85 Glen View Terrace
- 39 Glen View Terrace
- 331 Fairfield St
- 46 Glen View Terrace
- 74 Beverly Rd
- 30 Beverly Rd