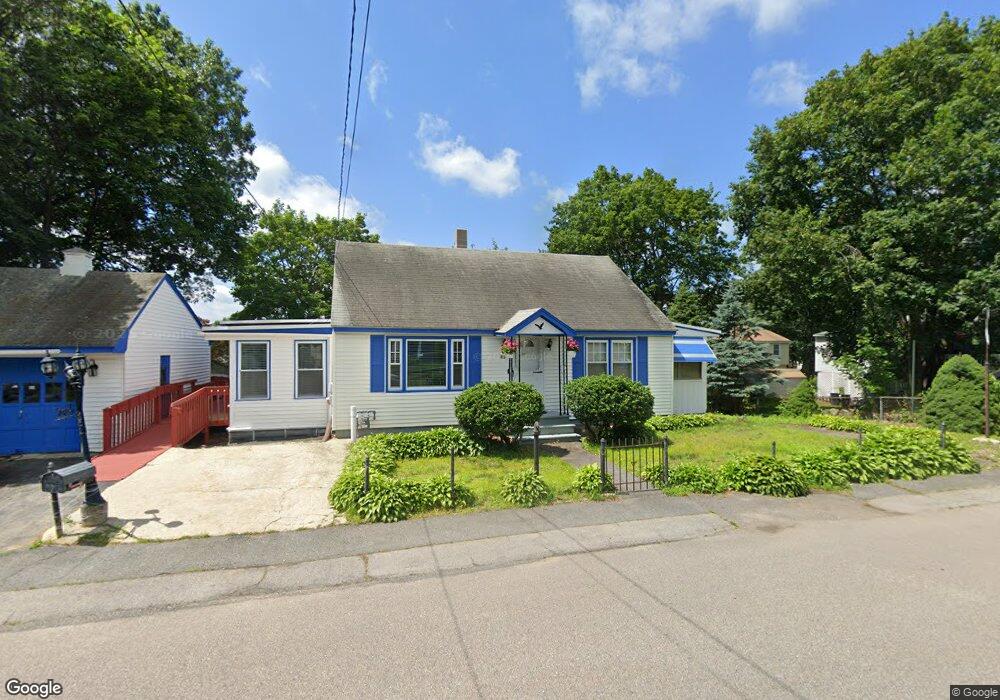
63 Harlem St Dracut, MA 01826
Estimated Value: $528,000 - $583,000
3
Beds
3
Baths
1,463
Sq Ft
$374/Sq Ft
Est. Value
About This Home
This home is located at 63 Harlem St, Dracut, MA 01826 and is currently estimated at $547,855, approximately $374 per square foot. 63 Harlem St is a home located in Middlesex County with nearby schools including George H. Englesby Elementary School, Richardson Middle School, and Dracut Senior High School.
Ownership History
Date
Name
Owned For
Owner Type
Purchase Details
Closed on
Feb 14, 2025
Sold by
Thiongo John T Est and Thiongo
Bought by
Thiongo Lucy
Current Estimated Value
Purchase Details
Closed on
Oct 22, 2004
Sold by
Economou Nicholas Est and Papakostas
Bought by
Thuo John Thiongo
Home Financials for this Owner
Home Financials are based on the most recent Mortgage that was taken out on this home.
Original Mortgage
$265,905
Interest Rate
5.85%
Mortgage Type
Purchase Money Mortgage
Create a Home Valuation Report for This Property
The Home Valuation Report is an in-depth analysis detailing your home's value as well as a comparison with similar homes in the area
Home Values in the Area
Average Home Value in this Area
Purchase History
| Date | Buyer | Sale Price | Title Company |
|---|---|---|---|
| Thiongo Lucy | -- | None Available | |
| Thiongo Lucy | -- | None Available | |
| Thuo John Thiongo | $279,900 | -- | |
| Thuo John Thiongo | $279,900 | -- |
Source: Public Records
Mortgage History
| Date | Status | Borrower | Loan Amount |
|---|---|---|---|
| Previous Owner | Thuo John Thiongo | $265,905 | |
| Previous Owner | Thuo John Thiongo | $4,245 |
Source: Public Records
Tax History
| Year | Tax Paid | Tax Assessment Tax Assessment Total Assessment is a certain percentage of the fair market value that is determined by local assessors to be the total taxable value of land and additions on the property. | Land | Improvement |
|---|---|---|---|---|
| 2025 | $4,558 | $450,400 | $186,100 | $264,300 |
| 2024 | $4,371 | $418,300 | $177,200 | $241,100 |
| 2023 | $4,226 | $364,900 | $154,100 | $210,800 |
| 2022 | $4,125 | $335,600 | $140,100 | $195,500 |
| 2021 | $4,004 | $307,800 | $127,400 | $180,400 |
| 2020 | $4,066 | $304,600 | $123,700 | $180,900 |
| 2019 | $14,318 | $298,700 | $117,800 | $180,900 |
| 2018 | $3,760 | $265,900 | $117,800 | $148,100 |
| 2017 | $13,968 | $265,900 | $117,800 | $148,100 |
| 2016 | $3,443 | $232,000 | $113,200 | $118,800 |
| 2015 | $3,377 | $226,200 | $113,200 | $113,000 |
| 2014 | $3,210 | $221,500 | $113,200 | $108,300 |
Source: Public Records
Map
Nearby Homes
- 94 Hampson St
- 244 White St
- 137 Crawford St
- 49 Sparks St
- 39 Phoebe Ave
- 45 Hoover St
- 28 Sarah Ave
- 25 Shea St Unit 8
- 101 Donohue Rd Unit 19
- 15 Louis Farm Rd Unit 15
- 75 Sladen St
- 16 Peabody Ave
- 30 4th Ave
- 109 Navy Yard Rd
- 19 Louis Farm Rd Unit 19
- 13 Louis Farm Rd Unit 13
- 89 Mammoth Rd
- 26 Farmland Rd Unit C
- 267 Pawtucket St
- 25 W 5th Ave