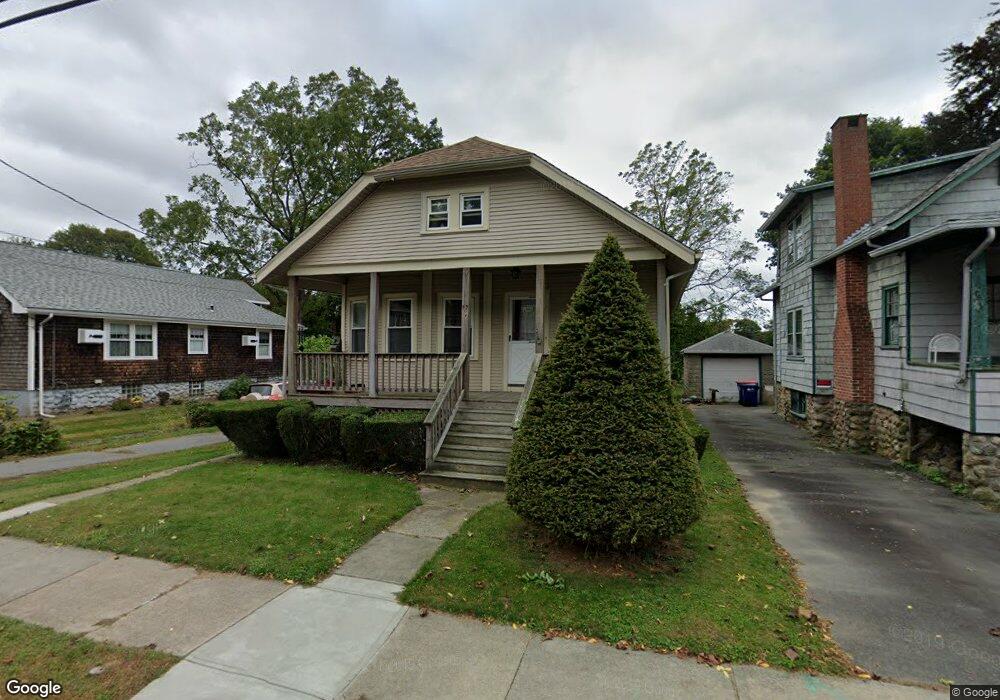
63 Hedge St Fairhaven, MA 02719
Oxford NeighborhoodEstimated Value: $436,803 - $454,000
3
Beds
1
Bath
997
Sq Ft
$448/Sq Ft
Est. Value
About This Home
This home is located at 63 Hedge St, Fairhaven, MA 02719 and is currently estimated at $446,201, approximately $447 per square foot. 63 Hedge St is a home located in Bristol County with nearby schools including Fairhaven High School, Alma Del Mar Charter School, and City On A Hill Charter Public School New Bedford.
Ownership History
Date
Name
Owned For
Owner Type
Purchase Details
Closed on
Sep 5, 2024
Sold by
Garcia John B and Garcia Maureen H
Bought by
Garcia Irt and Garcia
Current Estimated Value
Purchase Details
Closed on
Sep 26, 1990
Sold by
Reynolds Frederick
Bought by
Garcia John B
Home Financials for this Owner
Home Financials are based on the most recent Mortgage that was taken out on this home.
Original Mortgage
$83,040
Interest Rate
9.95%
Mortgage Type
Purchase Money Mortgage
Create a Home Valuation Report for This Property
The Home Valuation Report is an in-depth analysis detailing your home's value as well as a comparison with similar homes in the area
Home Values in the Area
Average Home Value in this Area
Purchase History
| Date | Buyer | Sale Price | Title Company |
|---|---|---|---|
| Garcia Irt | -- | None Available | |
| Garcia Irt | -- | None Available | |
| Garcia John B | $95,000 | -- | |
| Garcia John B | $95,000 | -- |
Source: Public Records
Mortgage History
| Date | Status | Borrower | Loan Amount |
|---|---|---|---|
| Previous Owner | Garcia John B | $25,000 | |
| Previous Owner | Garcia John B | $71,000 | |
| Previous Owner | Garcia John B | $80,000 | |
| Previous Owner | Garcia John B | $83,040 |
Source: Public Records
Tax History
| Year | Tax Paid | Tax Assessment Tax Assessment Total Assessment is a certain percentage of the fair market value that is determined by local assessors to be the total taxable value of land and additions on the property. | Land | Improvement |
|---|---|---|---|---|
| 2025 | $34 | $364,600 | $171,700 | $192,900 |
| 2024 | $3,276 | $354,900 | $171,700 | $183,200 |
| 2023 | $3,215 | $323,100 | $150,400 | $172,700 |
| 2022 | $3,123 | $305,600 | $139,800 | $165,800 |
| 2021 | $2,994 | $265,200 | $126,500 | $138,700 |
| 2020 | $5,211 | $265,200 | $126,500 | $138,700 |
| 2019 | $2,721 | $233,200 | $104,900 | $128,300 |
| 2018 | $2,737 | $223,100 | $99,800 | $123,300 |
| 2017 | $2,603 | $216,200 | $99,800 | $116,400 |
| 2016 | $2,522 | $207,100 | $99,800 | $107,300 |
| 2015 | $2,497 | $205,500 | $99,800 | $105,700 |
Source: Public Records
Map
Nearby Homes
- 442 Dana Farms
- 24 Academy Ave
- 313 Main St
- 14 Sycamore St
- 253 Adams St
- 15 School St
- 16 Ash St
- 138 Main St Unit 13
- 10 Livesey Pkwy
- 71 Sycamore St
- 67 Bridge St
- 39 Christian St
- 77 Adams St
- 0 Nulands Neck Unit 73286360
- 145 Pleasant St
- 8 Washington St
- 24 Cotter St
- 34 Washburn St Unit 36
- 58 Washington St
- 7 Deerfield Ln
Your Personal Tour Guide
Ask me questions while you tour the home.