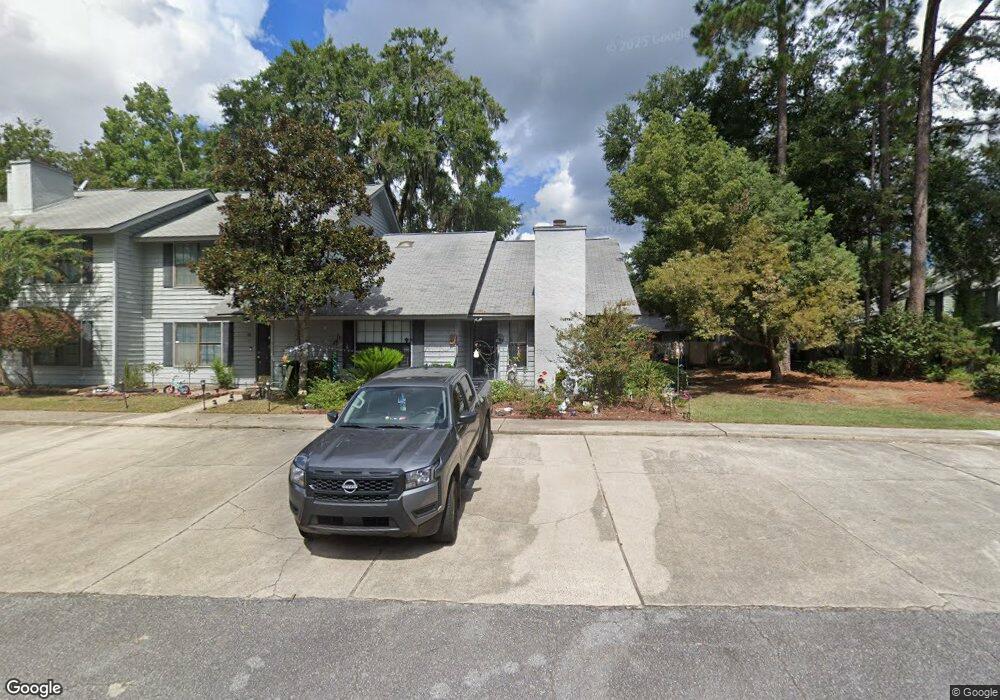
63 Hidden Lake Ct Savannah, GA 31419
Wilshire Estates NeighborhoodEstimated Value: $203,070 - $228,000
2
Beds
2
Baths
1,461
Sq Ft
$149/Sq Ft
Est. Value
About This Home
This home is located at 63 Hidden Lake Ct, Savannah, GA 31419 and is currently estimated at $217,518, approximately $148 per square foot. 63 Hidden Lake Ct is a home located in Chatham County with nearby schools including Windsor Forest High School, Southwest Elementary School, and Southwest Middle School.
Ownership History
Date
Name
Owned For
Owner Type
Purchase Details
Closed on
Mar 4, 2022
Sold by
Craig Austin D
Bought by
Frazier Developing Llc
Current Estimated Value
Home Financials for this Owner
Home Financials are based on the most recent Mortgage that was taken out on this home.
Original Mortgage
$108,750
Outstanding Balance
$101,175
Interest Rate
3.55%
Mortgage Type
Mortgage Modification
Estimated Equity
$116,343
Purchase Details
Closed on
Oct 31, 2013
Sold by
Fulton William J
Bought by
Craig Austin D and Craig Doris M
Purchase Details
Closed on
Feb 24, 2010
Sold by
Fulton Ann Skelly
Bought by
Fulton William J
Create a Home Valuation Report for This Property
The Home Valuation Report is an in-depth analysis detailing your home's value as well as a comparison with similar homes in the area
Home Values in the Area
Average Home Value in this Area
Purchase History
| Date | Buyer | Sale Price | Title Company |
|---|---|---|---|
| Frazier Developing Llc | $145,000 | -- | |
| Craig Austin D | $85,000 | -- | |
| Fulton William J | -- | -- |
Source: Public Records
Mortgage History
| Date | Status | Borrower | Loan Amount |
|---|---|---|---|
| Open | Frazier Developing Llc | $108,750 |
Source: Public Records
Tax History Compared to Growth
Tax History
| Year | Tax Paid | Tax Assessment Tax Assessment Total Assessment is a certain percentage of the fair market value that is determined by local assessors to be the total taxable value of land and additions on the property. | Land | Improvement |
|---|---|---|---|---|
| 2025 | $1,528 | $90,360 | $16,000 | $74,360 |
| 2024 | $1,528 | $55,440 | $16,000 | $39,440 |
| 2023 | $708 | $58,000 | $5,680 | $52,320 |
| 2022 | $157 | $42,840 | $6,000 | $36,840 |
| 2021 | $186 | $36,640 | $6,000 | $30,640 |
| 2020 | $194 | $36,640 | $6,000 | $30,640 |
| 2019 | $280 | $36,640 | $6,000 | $30,640 |
| 2018 | $252 | $35,680 | $6,000 | $29,680 |
| 2017 | $6 | $30,520 | $6,000 | $24,520 |
| 2016 | $11 | $30,360 | $6,000 | $24,360 |
| 2015 | $80 | $31,920 | $6,000 | $25,920 |
| 2014 | $106 | $32,520 | $0 | $0 |
Source: Public Records
Map
Nearby Homes
- 59 Hidden Lake Ct
- 57 Hidden Lake Ct
- 69 Hidden Lake Ct
- 49 Hidden Lake Ct
- 40 Hidden Lake Ct
- 1027 Mohawk St
- 1025 Mohawk St
- 1159 Mohawk St Unit H3
- 1159 Mohawk St
- 1159 Mohawk St Unit B3
- 12 Kingslan Ct
- 28 Kingslan Ct
- 1027 Dutchtown Rd
- 40 Hidden Pointe Dr
- 118 Hidden Way
- 116 Hidden Way
- 114 Hidden Way
- 112 Hidden Way
- 39 Hidden Pointe Dr
- Gwinnett Plan at Hidden Pointe
- 61 Hidden Lake Ct
- 1 Hidden Lake Ct
- 3 Hidden Lake Ct
- 55 Hidden Lake Ct
- 67 Hidden Lake Ct
- 65 Hidden Lake Ct
- 7 Hidden Lake Ct
- 71 Hidden Lake Ct
- 53 Hidden Lake Ct
- 88 Hidden Lake Ct
- 9 Hidden Lake Ct
- 86 Hidden Lake Ct
- 94 Hidden Lake Ct
- 51 Hidden Lake Ct
- 92 Hidden Lake Ct
- 90 Hidden Lake Ct
- 84 Hidden Lake Ct
- 98 Hidden Lake Ct
- 11 Hidden Lake Ct
- 82 Hidden Lake Ct