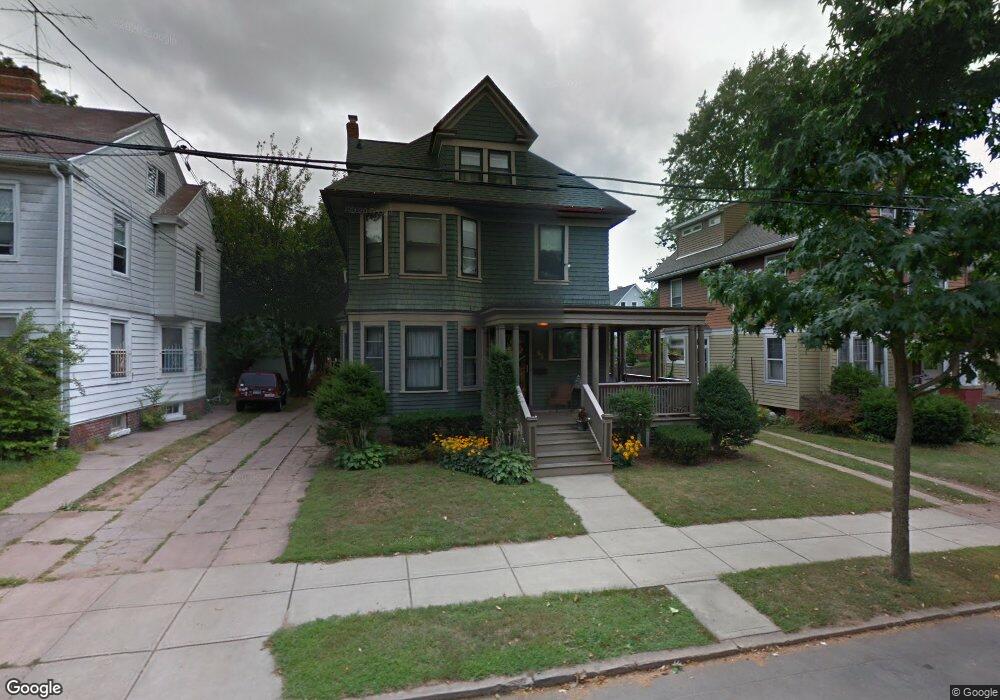
63 Hobart St New Haven, CT 06511
Edgewood NeighborhoodEstimated Value: $537,615 - $671,000
4
Beds
3
Baths
2,173
Sq Ft
$270/Sq Ft
Est. Value
About This Home
This home is located at 63 Hobart St, New Haven, CT 06511 and is currently estimated at $587,154, approximately $270 per square foot. 63 Hobart St is a home located in New Haven County with nearby schools including Elm City Montessori School and Yeshiva Gedolah Rabbinical Inst.
Ownership History
Date
Name
Owned For
Owner Type
Purchase Details
Closed on
Jul 10, 2024
Sold by
Foh Inc
Bought by
Combs Robert and Combs Laura
Current Estimated Value
Home Financials for this Owner
Home Financials are based on the most recent Mortgage that was taken out on this home.
Original Mortgage
$508,250
Outstanding Balance
$502,226
Interest Rate
7.03%
Mortgage Type
Purchase Money Mortgage
Estimated Equity
$84,928
Purchase Details
Closed on
May 9, 2001
Sold by
Robichaud Michael
Bought by
Foh Inc
Purchase Details
Closed on
Aug 11, 1989
Sold by
Robichaud Michael B
Bought by
Humphrey Jennie F
Purchase Details
Closed on
Sep 21, 1987
Sold by
Phillips Sidney H
Bought by
Humphrey Jennie F
Home Financials for this Owner
Home Financials are based on the most recent Mortgage that was taken out on this home.
Original Mortgage
$120,000
Interest Rate
10.35%
Create a Home Valuation Report for This Property
The Home Valuation Report is an in-depth analysis detailing your home's value as well as a comparison with similar homes in the area
Home Values in the Area
Average Home Value in this Area
Purchase History
| Date | Buyer | Sale Price | Title Company |
|---|---|---|---|
| Combs Robert | $535,000 | None Available | |
| Foh Inc | $25,000 | -- | |
| Humphrey Jennie F | $2,000 | -- | |
| Humphrey Jennie F | $229,900 | -- |
Source: Public Records
Mortgage History
| Date | Status | Borrower | Loan Amount |
|---|---|---|---|
| Open | Combs Robert | $508,250 | |
| Previous Owner | Humphrey Jennie F | $99,419 | |
| Previous Owner | Humphrey Jennie F | $48,000 | |
| Previous Owner | Humphrey Jennie F | $120,000 |
Source: Public Records
Tax History Compared to Growth
Tax History
| Year | Tax Paid | Tax Assessment Tax Assessment Total Assessment is a certain percentage of the fair market value that is determined by local assessors to be the total taxable value of land and additions on the property. | Land | Improvement |
|---|---|---|---|---|
| 2025 | $7,300 | $185,290 | $48,370 | $136,920 |
| 2024 | $7,134 | $185,290 | $48,370 | $136,920 |
| 2023 | $6,893 | $185,290 | $48,370 | $136,920 |
| 2022 | $7,365 | $185,290 | $48,370 | $136,920 |
| 2021 | $6,573 | $149,800 | $41,650 | $108,150 |
| 2020 | $6,573 | $149,800 | $41,650 | $108,150 |
| 2019 | $6,438 | $149,800 | $41,650 | $108,150 |
| 2018 | $6,438 | $149,800 | $41,650 | $108,150 |
| 2017 | $5,794 | $149,800 | $41,650 | $108,150 |
| 2016 | $5,704 | $137,270 | $32,760 | $104,510 |
| 2015 | $5,704 | $137,270 | $32,760 | $104,510 |
| 2014 | $5,704 | $137,270 | $32,760 | $104,510 |
Source: Public Records
Map
Nearby Homes