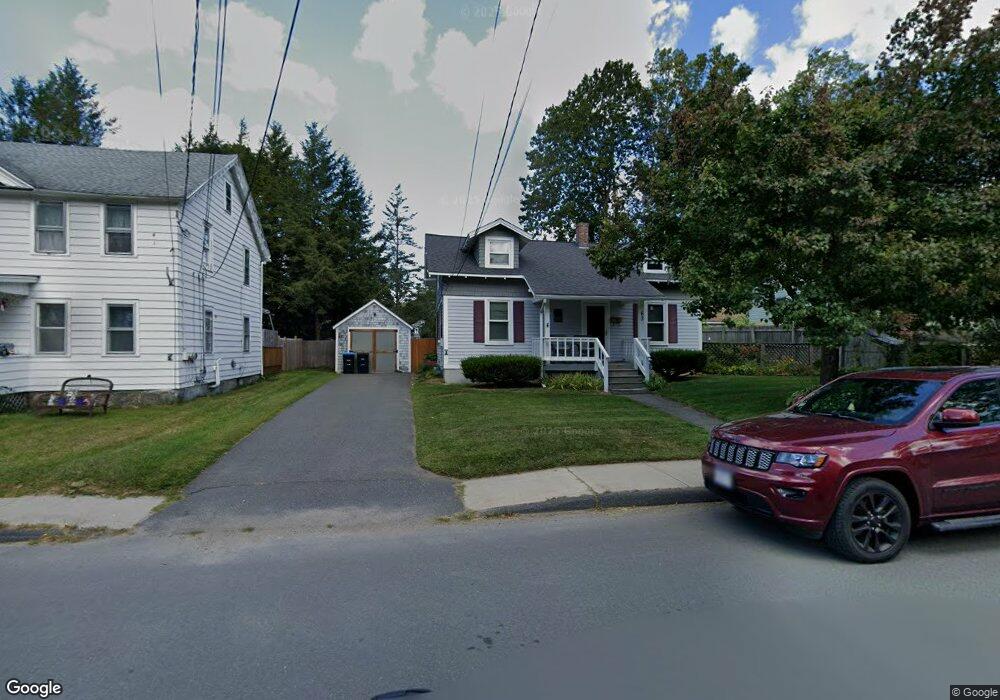
63 John St Dalton, MA 01226
Estimated Value: $207,000 - $257,213
3
Beds
2
Baths
1,104
Sq Ft
$217/Sq Ft
Est. Value
About This Home
This home is located at 63 John St, Dalton, MA 01226 and is currently estimated at $240,053, approximately $217 per square foot. 63 John St is a home located in Berkshire County with nearby schools including Wahconah Regional High School, St. Agnes Academy, and Sacred Heart School.
Ownership History
Date
Name
Owned For
Owner Type
Purchase Details
Closed on
Dec 23, 2004
Sold by
Pinna Gail A
Bought by
Pinna Michael J
Current Estimated Value
Home Financials for this Owner
Home Financials are based on the most recent Mortgage that was taken out on this home.
Original Mortgage
$60,000
Outstanding Balance
$29,862
Interest Rate
5.74%
Mortgage Type
Purchase Money Mortgage
Estimated Equity
$210,191
Create a Home Valuation Report for This Property
The Home Valuation Report is an in-depth analysis detailing your home's value as well as a comparison with similar homes in the area
Home Values in the Area
Average Home Value in this Area
Purchase History
| Date | Buyer | Sale Price | Title Company |
|---|---|---|---|
| Pinna Michael J | $120,000 | -- | |
| Pinna Michael J | $120,000 | -- |
Source: Public Records
Mortgage History
| Date | Status | Borrower | Loan Amount |
|---|---|---|---|
| Open | Pinna Michael J | $60,000 | |
| Closed | Pinna Michael J | $60,000 | |
| Previous Owner | Pinna Michael J | $45,000 |
Source: Public Records
Tax History
| Year | Tax Paid | Tax Assessment Tax Assessment Total Assessment is a certain percentage of the fair market value that is determined by local assessors to be the total taxable value of land and additions on the property. | Land | Improvement |
|---|---|---|---|---|
| 2025 | $3,762 | $207,500 | $54,700 | $152,800 |
| 2024 | $3,505 | $192,600 | $49,500 | $143,100 |
| 2023 | $2,928 | $164,000 | $43,800 | $120,200 |
| 2022 | $2,928 | $141,200 | $43,800 | $97,400 |
| 2021 | $2,887 | $134,200 | $41,700 | $92,500 |
| 2020 | $2,621 | $129,200 | $41,700 | $87,500 |
| 2019 | $2,400 | $123,200 | $41,700 | $81,500 |
| 2018 | $3,367 | $120,000 | $41,700 | $78,300 |
| 2017 | $2,384 | $120,000 | $41,700 | $78,300 |
| 2016 | $2,356 | $120,000 | $41,700 | $78,300 |
| 2015 | $2,319 | $119,100 | $41,700 | $77,400 |
Source: Public Records
Map
Nearby Homes
- 18 Chestnut St
- 165 High St
- 20 Prospect St
- 750 Main St
- 60 North St Unit 7
- 0 Crane Ave
- 60 Franklin St
- 188 North St
- 70 Lake St Unit B
- 32 Marcella Way
- 149 Kittredge Rd
- 1030 Main St
- 121 Kittredge Rd
- 0 Crane Ave Suite 2 -- Unit 248430
- 0 Crane Ave Suite 1 -- Unit 248429
- 127 Pinecrest Dr
- 1157 Main St
- 68 Howe Rd
- 395 Cheshire Rd Unit 114
- 395 Cheshire Rd Unit 103
Your Personal Tour Guide
Ask me questions while you tour the home.