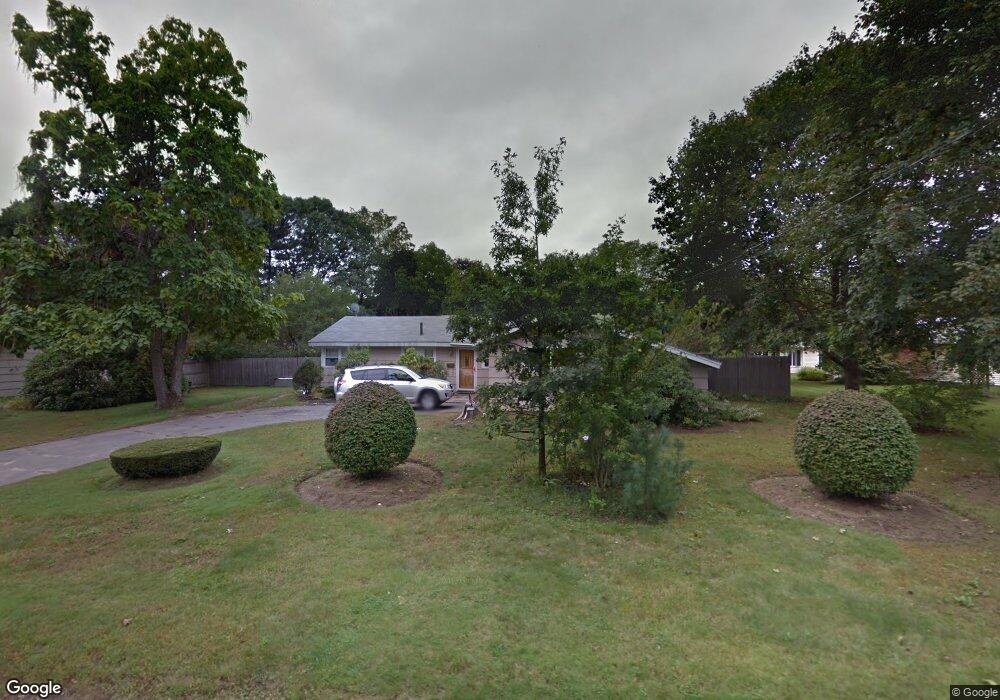
63 Joseph Rd Framingham, MA 01701
Nobscot NeighborhoodEstimated Value: $558,671 - $656,000
3
Beds
2
Baths
1,415
Sq Ft
$432/Sq Ft
Est. Value
About This Home
This home is located at 63 Joseph Rd, Framingham, MA 01701 and is currently estimated at $610,918, approximately $431 per square foot. 63 Joseph Rd is a home located in Middlesex County with nearby schools including Framingham High School and MetroWest Jewish Day School.
Ownership History
Date
Name
Owned For
Owner Type
Purchase Details
Closed on
Jan 25, 2021
Sold by
Pacitto Ferdinand and Pacitto Mary E
Bought by
Pacitto Ft and Crowley
Current Estimated Value
Purchase Details
Closed on
Feb 2, 1987
Sold by
Moulaison Robert M
Bought by
Pacitto Ferdinand
Home Financials for this Owner
Home Financials are based on the most recent Mortgage that was taken out on this home.
Original Mortgage
$95,000
Interest Rate
9.26%
Mortgage Type
Purchase Money Mortgage
Create a Home Valuation Report for This Property
The Home Valuation Report is an in-depth analysis detailing your home's value as well as a comparison with similar homes in the area
Home Values in the Area
Average Home Value in this Area
Purchase History
| Date | Buyer | Sale Price | Title Company |
|---|---|---|---|
| Pacitto Ft | -- | None Available | |
| Pacitto Ferdinand | $110,000 | -- |
Source: Public Records
Mortgage History
| Date | Status | Borrower | Loan Amount |
|---|---|---|---|
| Previous Owner | Pacitto Ferdinand | $25,000 | |
| Previous Owner | Pacitto Ferdinand | $95,000 |
Source: Public Records
Tax History
| Year | Tax Paid | Tax Assessment Tax Assessment Total Assessment is a certain percentage of the fair market value that is determined by local assessors to be the total taxable value of land and additions on the property. | Land | Improvement |
|---|---|---|---|---|
| 2025 | $5,977 | $500,600 | $271,200 | $229,400 |
| 2024 | $5,692 | $456,800 | $242,200 | $214,600 |
| 2023 | $5,394 | $412,100 | $216,200 | $195,900 |
| 2022 | $5,087 | $370,200 | $196,200 | $174,000 |
| 2021 | $4,954 | $352,600 | $188,600 | $164,000 |
| 2020 | $5,059 | $337,700 | $171,300 | $166,400 |
| 2019 | $4,991 | $324,500 | $171,300 | $153,200 |
| 2018 | $4,896 | $300,000 | $164,900 | $135,100 |
| 2017 | $4,791 | $286,700 | $160,100 | $126,600 |
| 2016 | $4,654 | $267,800 | $160,100 | $107,700 |
| 2015 | $4,589 | $257,500 | $160,700 | $96,800 |
Source: Public Records
Map
Nearby Homes
- 4 Tartufi Cir
- 11 Edith Rd
- 227 Water St
- 19 Rolling Ln
- 472 Potter Rd
- 19 Park Ave
- 2 Chesterfield St
- 81 Nicholas Rd Unit B
- 38 Bradford Rd
- 36 Cider Mill Rd
- 62 Central St
- 356 Central St
- 54 Roundtop Rd
- 106 Baldwin Ave
- 13 Potter Rd
- 11 Danforth Park Rd
- 19 Nob Hill Dr
- 301 Windsor Dr
- 907 Windsor Dr
- 0 Wagonwheel Rd
Your Personal Tour Guide
Ask me questions while you tour the home.