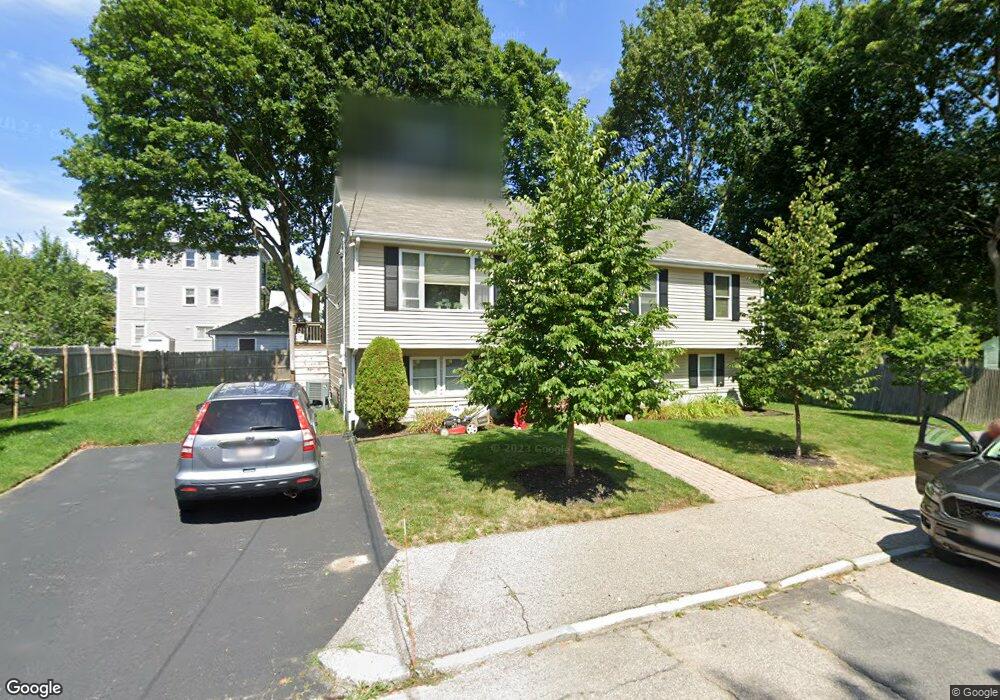
63 Linnea Ave Brockton, MA 02301
Clifton Heights NeighborhoodEstimated Value: $463,000 - $531,811
3
Beds
1
Bath
1,144
Sq Ft
$439/Sq Ft
Est. Value
About This Home
This home is located at 63 Linnea Ave, Brockton, MA 02301 and is currently estimated at $502,703, approximately $439 per square foot. 63 Linnea Ave is a home located in Plymouth County with nearby schools including Gilmore Elementary School, John F. Kennedy Elementary School, and Davis K-8 School.
Ownership History
Date
Name
Owned For
Owner Type
Purchase Details
Closed on
Sep 17, 2007
Sold by
Silva Felisberto M and Silva Helena R
Bought by
Corcoran Linda M
Current Estimated Value
Home Financials for this Owner
Home Financials are based on the most recent Mortgage that was taken out on this home.
Original Mortgage
$265,905
Interest Rate
6.7%
Mortgage Type
Purchase Money Mortgage
Create a Home Valuation Report for This Property
The Home Valuation Report is an in-depth analysis detailing your home's value as well as a comparison with similar homes in the area
Home Values in the Area
Average Home Value in this Area
Purchase History
| Date | Buyer | Sale Price | Title Company |
|---|---|---|---|
| Corcoran Linda M | $279,900 | -- |
Source: Public Records
Mortgage History
| Date | Status | Borrower | Loan Amount |
|---|---|---|---|
| Open | Corcoran Linda M | $262,515 | |
| Closed | Corcoran Linda M | $265,905 | |
| Previous Owner | Corcoran Linda M | $325,000 |
Source: Public Records
Tax History
| Year | Tax Paid | Tax Assessment Tax Assessment Total Assessment is a certain percentage of the fair market value that is determined by local assessors to be the total taxable value of land and additions on the property. | Land | Improvement |
|---|---|---|---|---|
| 2025 | $6,102 | $503,900 | $136,900 | $367,000 |
| 2024 | $5,845 | $486,300 | $136,900 | $349,400 |
| 2023 | $5,593 | $430,900 | $102,300 | $328,600 |
| 2022 | $5,060 | $362,200 | $92,800 | $269,400 |
| 2021 | $4,595 | $316,900 | $76,800 | $240,100 |
| 2020 | $4,542 | $299,800 | $72,300 | $227,500 |
| 2019 | $4,444 | $286,000 | $70,100 | $215,900 |
| 2018 | $4,399 | $273,900 | $70,100 | $203,800 |
| 2017 | $3,685 | $228,900 | $70,100 | $158,800 |
| 2016 | $3,896 | $224,400 | $67,900 | $156,500 |
| 2015 | $3,851 | $212,200 | $67,900 | $144,300 |
| 2014 | $3,428 | $189,100 | $67,900 | $121,200 |
Source: Public Records
Map
Nearby Homes
Your Personal Tour Guide
Ask me questions while you tour the home.