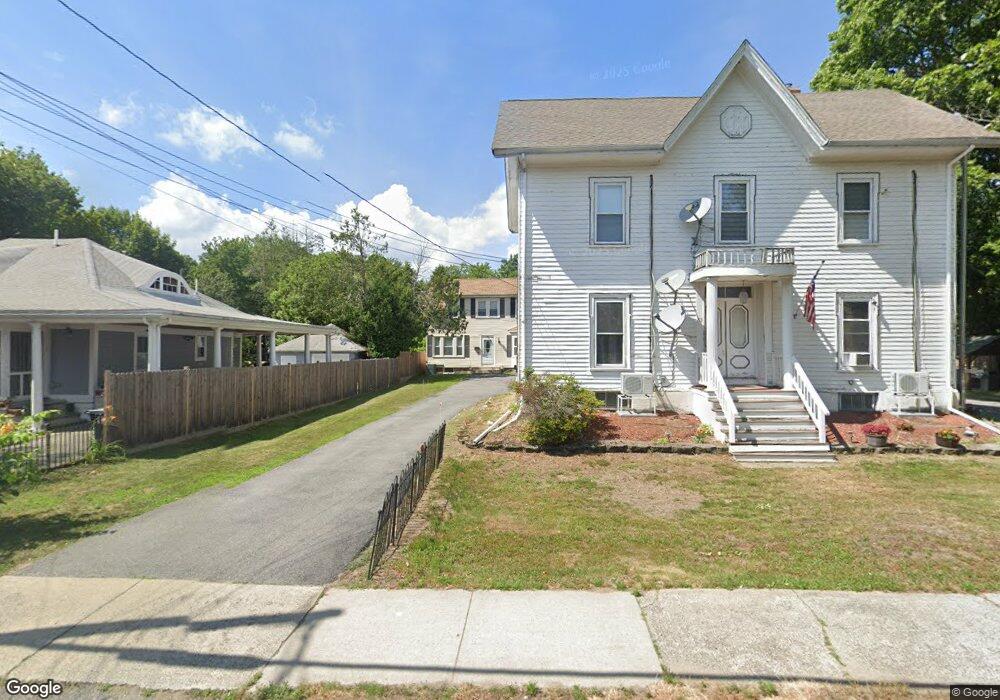
63 Main St Saugus, MA 01906
Downtown Saugus NeighborhoodEstimated Value: $755,442 - $858,000
4
Beds
2
Baths
2,685
Sq Ft
$301/Sq Ft
Est. Value
About This Home
This home is located at 63 Main St, Saugus, MA 01906 and is currently estimated at $806,861, approximately $300 per square foot. 63 Main St is a home located in Essex County with nearby schools including Saugus High School, Pioneer Charter School Of Science II, and Sacred Heart School.
Ownership History
Date
Name
Owned For
Owner Type
Purchase Details
Closed on
Jan 15, 2004
Sold by
Gaeta Maureen and Johnson Shane J
Bought by
Behremovic Almir and Smajic Mirsada
Current Estimated Value
Home Financials for this Owner
Home Financials are based on the most recent Mortgage that was taken out on this home.
Original Mortgage
$332,000
Interest Rate
5.98%
Mortgage Type
Purchase Money Mortgage
Purchase Details
Closed on
Dec 19, 2002
Sold by
Thomas Susan
Bought by
Johnson Shane J and Gaeta Maureen
Purchase Details
Closed on
Aug 6, 2002
Sold by
Forni Frederick M and Forni Stacey M
Bought by
Thomas Susan
Purchase Details
Closed on
May 26, 1994
Sold by
Steward Doris H
Bought by
Forni Frederick
Create a Home Valuation Report for This Property
The Home Valuation Report is an in-depth analysis detailing your home's value as well as a comparison with similar homes in the area
Home Values in the Area
Average Home Value in this Area
Purchase History
| Date | Buyer | Sale Price | Title Company |
|---|---|---|---|
| Behremovic Almir | $415,000 | -- | |
| Johnson Shane J | $450,000 | -- | |
| Thomas Susan | $425,000 | -- | |
| Forni Frederick | $130,000 | -- |
Source: Public Records
Mortgage History
| Date | Status | Borrower | Loan Amount |
|---|---|---|---|
| Open | Forni Frederick | $292,150 | |
| Closed | Forni Frederick | $332,000 |
Source: Public Records
Tax History
| Year | Tax Paid | Tax Assessment Tax Assessment Total Assessment is a certain percentage of the fair market value that is determined by local assessors to be the total taxable value of land and additions on the property. | Land | Improvement |
|---|---|---|---|---|
| 2025 | $6,453 | $604,200 | $301,200 | $303,000 |
| 2024 | $6,079 | $570,800 | $273,800 | $297,000 |
| 2023 | $5,963 | $529,600 | $246,500 | $283,100 |
| 2022 | $5,712 | $475,600 | $225,500 | $250,100 |
| 2021 | $5,280 | $427,900 | $196,300 | $231,600 |
| 2020 | $4,991 | $418,700 | $187,100 | $231,600 |
| 2019 | $4,878 | $400,500 | $168,900 | $231,600 |
| 2018 | $4,434 | $382,900 | $164,300 | $218,600 |
| 2017 | $4,121 | $342,000 | $153,400 | $188,600 |
| 2016 | $3,705 | $303,700 | $145,900 | $157,800 |
| 2015 | $3,476 | $289,200 | $139,000 | $150,200 |
| 2014 | $3,575 | $307,900 | $139,000 | $168,900 |
Source: Public Records
Map
Nearby Homes
Your Personal Tour Guide
Ask me questions while you tour the home.